


HUD published the FY 2027 Fair Market Rents and Small Area Fair Market Rents on September 1. They take effect October 1, and they are the reference point underneath every Section 8 contract renewal in the fiscal year that starts next month.
Nationally the two-bedroom SAFMR rose 1.7 percent. That is the smallest increase in five years, and read on its own it looks like a market that has stopped moving. The market has not stopped moving. What has happened is that the benchmark has finally caught up to a period that ended some time ago.
The offset, in eight years of data
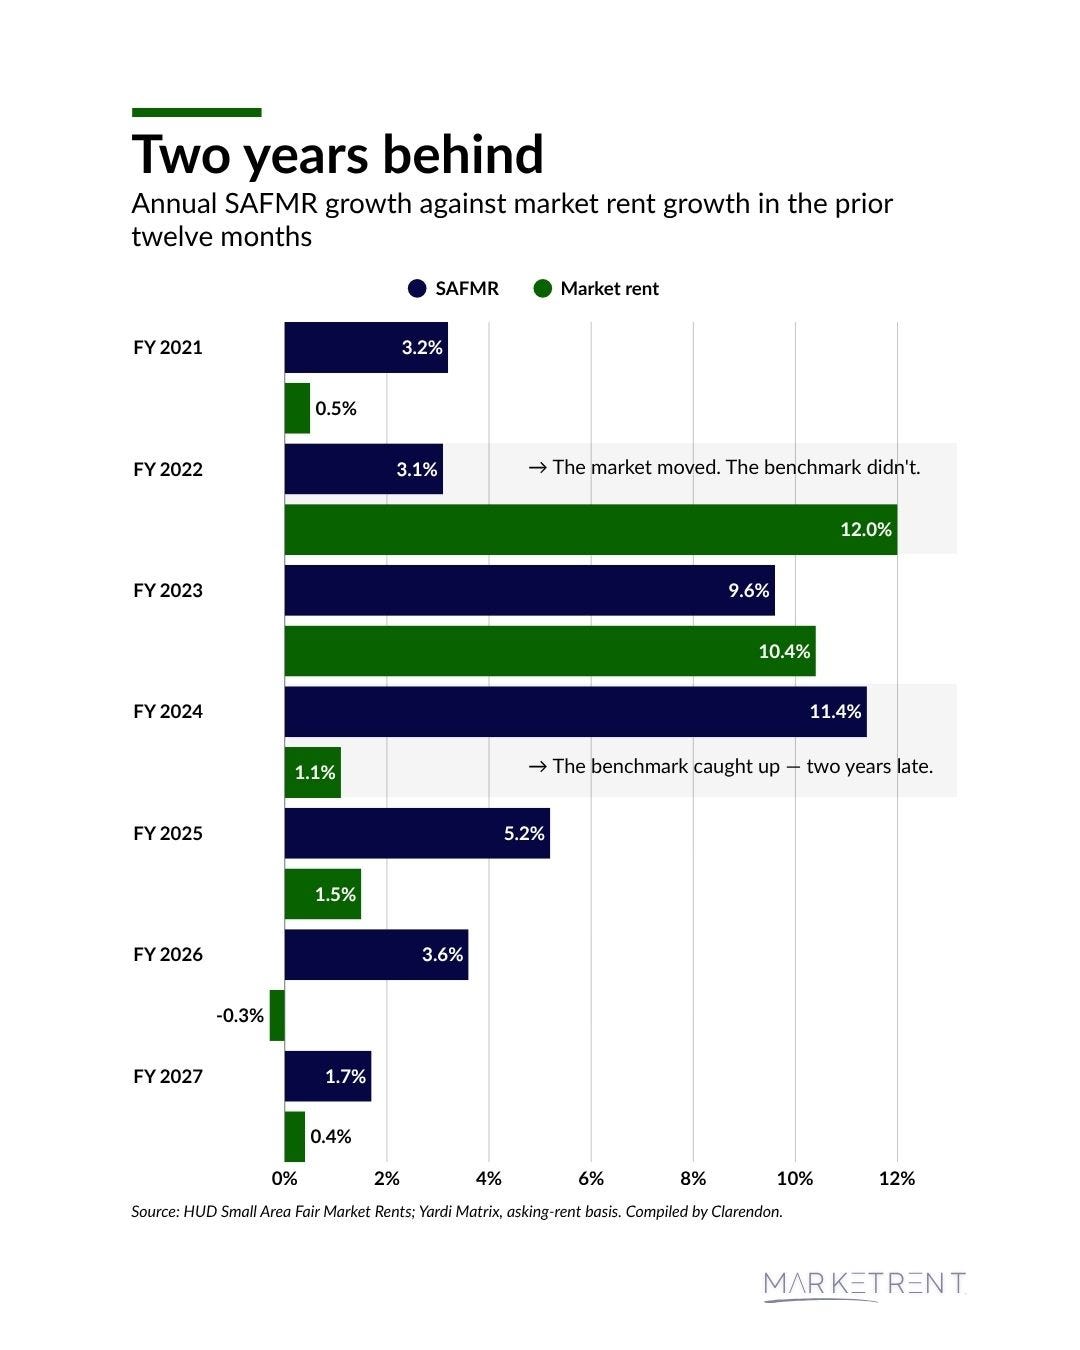
Set HUD’s annual SAFMR change against what the market actually did in the twelve months immediately before each fiscal year took effect, and the relationship is visible without interpretation.
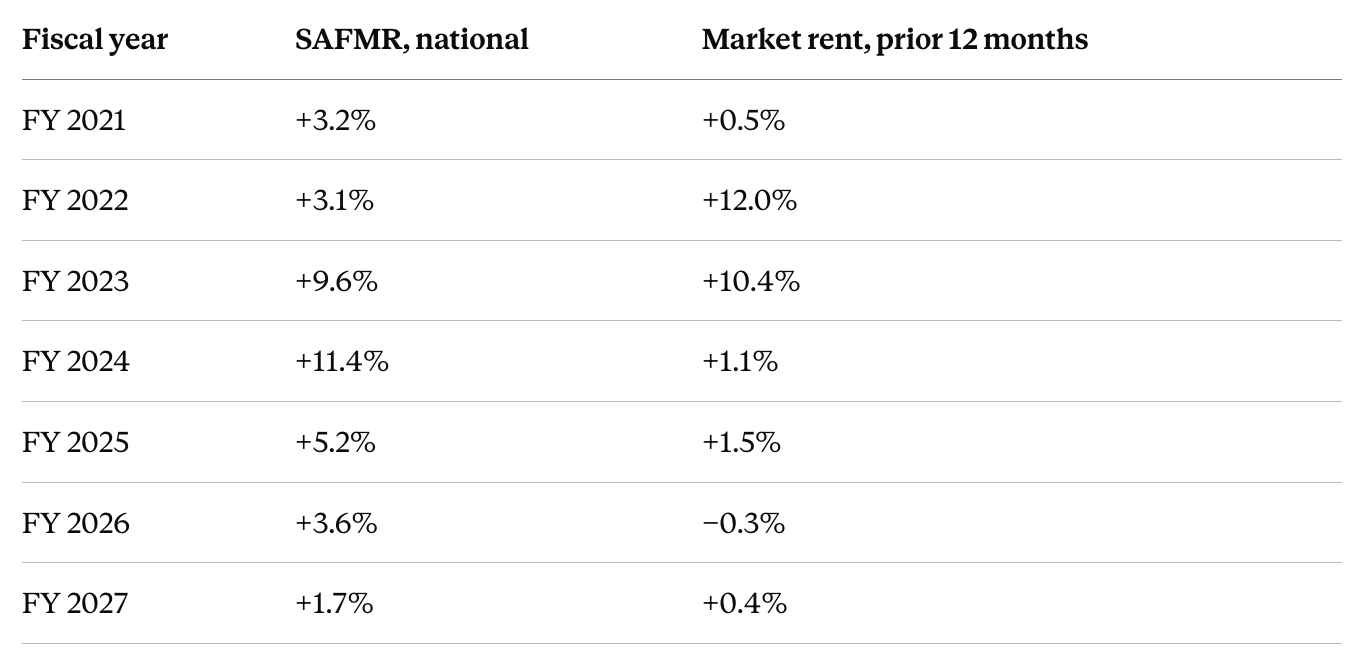
Two rows carry it. In FY 2022 the market had just run 12.0 percent and the benchmark moved 3.1. Two years later, in FY 2024, the benchmark moved 11.4 percent into a market that had just posted 1.1.
That is not an error. SAFMRs are 40th-percentile recent-mover gross rent estimates built from American Community Survey data and trended forward. The survey data is already a few years old at the effective date, and the trending factors correct for inflation rather than for a turn in the market. In a stable market the lag is invisible. Through a surge and a correction it produces exactly what the table shows: the benchmark climbing hardest in the years the market was flattest.
Where that leaves the arithmetic
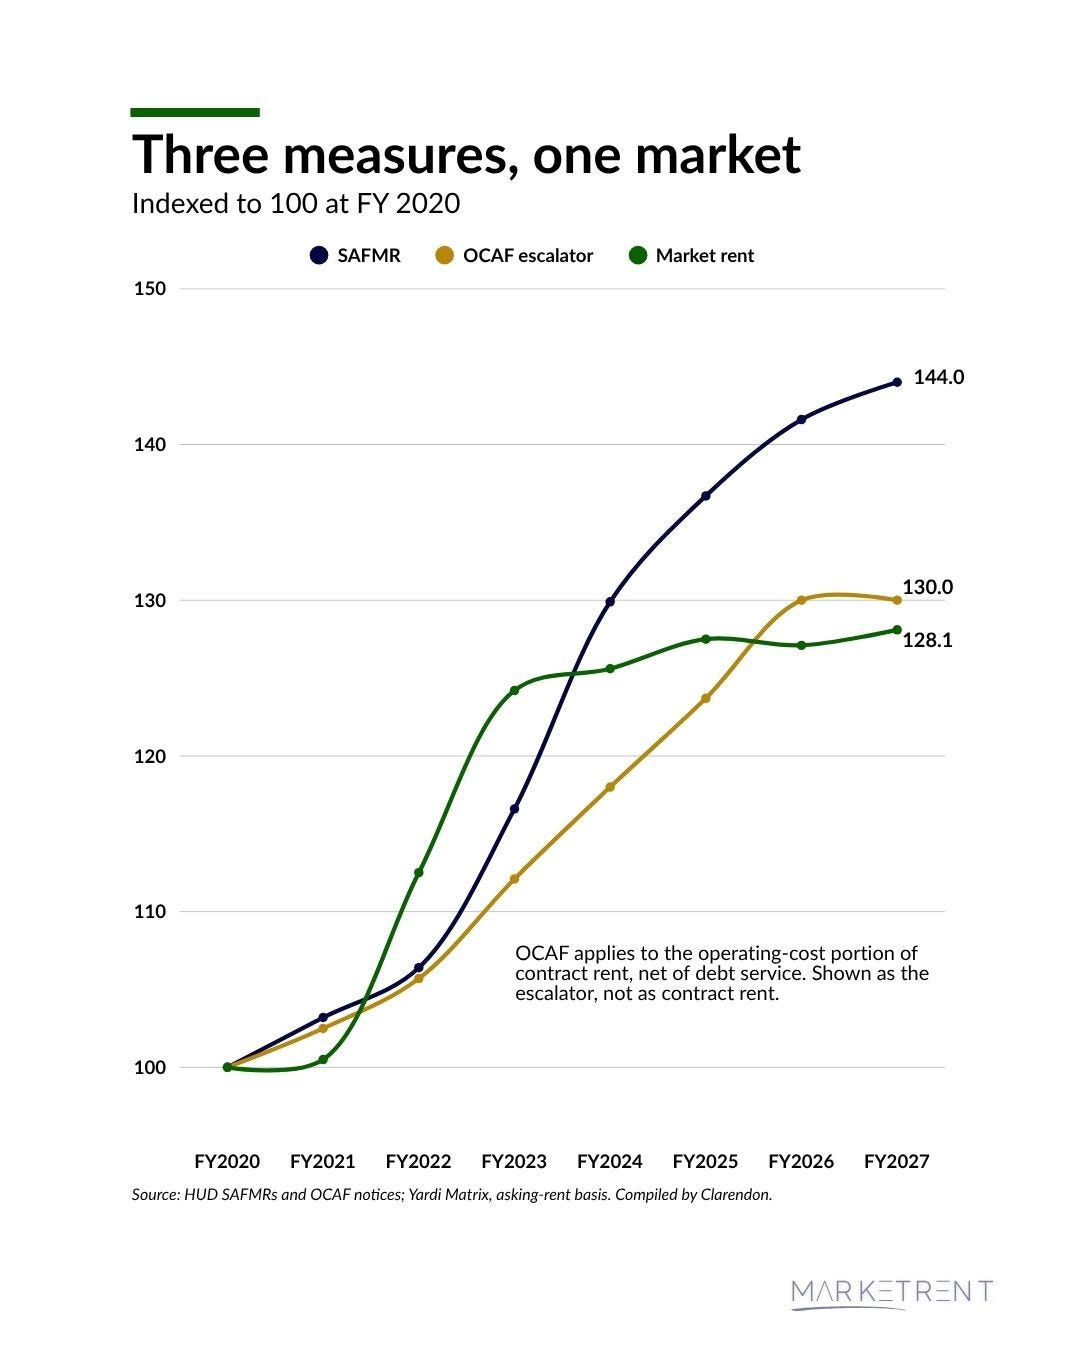
Over the full eight fiscal years, national SAFMRs rose 44.0 percent. Actual market rent, weighted across every asset class from luxury to the affordable floor, rose 28.1 percent. The OCAF escalator over the same span compounded to about 30 percent.
Both administrative measures outran the market, and they did it for different reasons. The SAFMR overshot because it was still processing 2021 and 2022. OCAF ran ahead because operating costs — insurance above all — genuinely rose faster than rents did.
Worth being precise about that last figure. OCAF applies to the operating-cost portion of contract rent, net of debt service, so 30 percent is the escalator applied to a share of the rent rather than the increase in the rent itself. The actual contract rent increase is lower and varies with capital structure. But the direction is not in question, and neither is the gap.
The first position: contracts that ran past the market
That combination — a benchmark that overshot and an escalator that compounded — put a meaningful set of contracts above the market they sit in.
Across the 23,735 HUD contracts that can be matched to a ZIP-level FY 2027 SAFMR, 37.6 percent now carry rents above their ZIP benchmark. The median contract sits at 92 percent of it. At the far end, 553 contracts — covering roughly 41,000 assisted units — exceed 150 percent of their ZIP SAFMR.
The concentration is structural rather than random. It clusters where contract rents were set at a favorable moment and escalated steadily afterward, in ZIP codes whose benchmarks did not keep pace — and it is thinnest in the metros where the benchmark ran hardest over the last four years.
For an owner in that position, nothing about it is a failing. The rent was set correctly at the time and adjusted by the formula HUD provides. But it does mean the renewal conversation will turn on what the market currently supports, and that is a question the published federal data cannot answer at the property level.
The second position: Cleveland
Cleveland shows the second position: a benchmark that went quiet in a market that did not. Where the first position develops slowly — a contract drifting upward over years of formula adjustments — this one opened in a single year, which makes it both easier to see and easier to document.
Cleveland-Akron market rents rose 40.3 percent over the same eight years while the metro’s SAFMRs rose 45.9 — close enough that the two tracked each other most of the way. Then FY 2027 separated them. The Cleveland SAFMR came in at −0.6 percent. Cleveland market rents in July were running +3.3 percent year over year, roughly eight times the national rate of +0.4 and among the strongest of the large Midwest metros.
That is the first year in the series the two moved in opposite directions, and it is the year the benchmark stopped while the market did not.
The effect already shows in the contracts. In the Cleveland MSA, 53.3 percent of Section 8 contracts sit above their ZIP SAFMR against 37.6 percent nationally, at a median of 103 percent of the benchmark versus 92. Cleveland owners are not above market. They are above a benchmark that has gone quiet in a market that has not.
What “flat” actually looks like at the ZIP level
Cleveland’s metro figure is an average of 113 ZIP codes, and the average conceals how little movement there was in either direction. Seventy ZIP codes came in below FY 2026, but the median decline was $20 a month. Forty-five of those seventy fell by $20 or less and twenty-seven by $10 or less, against a series HUD rounds to the nearest ten dollars. Seventeen ZIP codes did not move at all.
The right reading is flat, not falling.
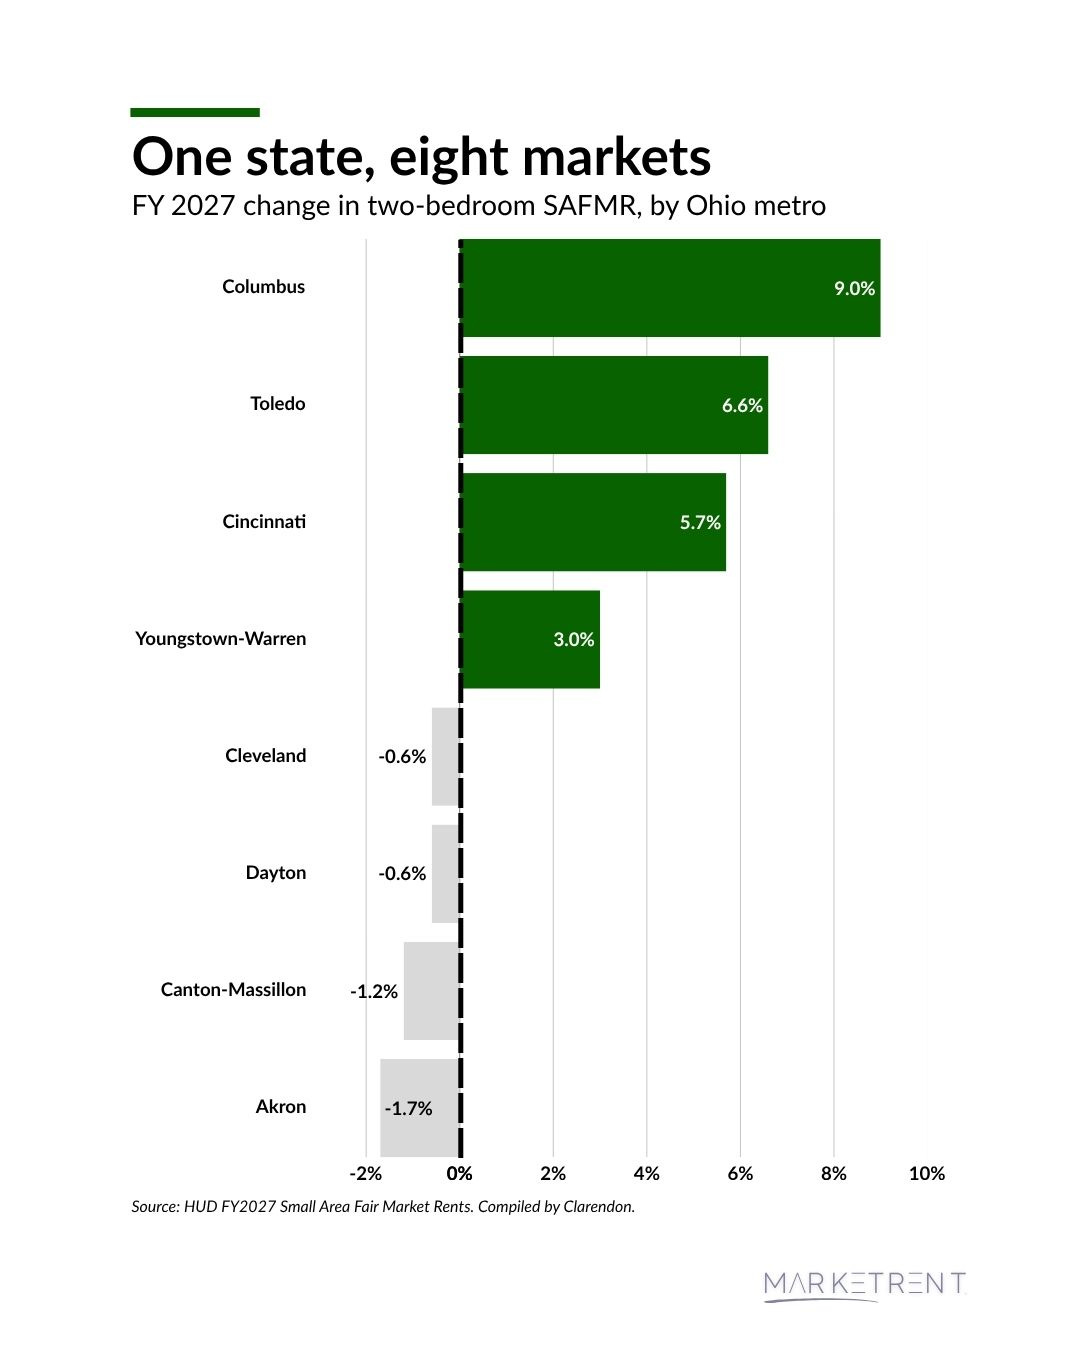
Ohio as a whole is a useful reminder that a state figure is no better. The statewide two-bedroom SAFMR rose 3.4 percent. Underneath it, Columbus rose 9.0 percent across 142 ZIP codes, Toledo 6.6, Cincinnati 5.7, Youngstown-Warren 3.0 — while Cleveland came in at −0.6, Dayton −0.6, Canton-Massillon −1.2, and Akron −1.7. Ten and a half points separate Columbus from Akron. Both are in Ohio, which matters more than it sounds, because OCAF is set at the state level. Every assisted property in Ohio receives the same operating-cost adjustment each year — the 2026 factor was 4.9 percent — whether the benchmark in its own ZIP code rose nine percent or fell nearly two. The adjustment cannot see the ZIP, and after this release the two ends of the state are further apart than a single statewide factor can account for.
Columbus’s nine percent is worth reading carefully, though. It is a benchmark catching up to growth that already occurred as the survey vintage rolled forward, not a forecast of growth to come. Anyone reading it as a leading indicator has the direction of the instrument backwards.
The sharpest single figure in the Ohio data is not a metro at all. Akron’s downtown ZIP, 44308, went from $1,120 to $1,560 — up 39.3 percent — inside a metro that averaged −1.7 percent and where five of six ZIP codes moved down. An owner reading the metro number would conclude the benchmark moved against them. The ZIP says it rose by nearly two-fifths.

These figures are not final
One more thing about the September release: it is a first draft.
Under the Housing Opportunity Through Modernization Act, HUD runs a reevaluation process on the same calendar every year. Requests are due October 1, and revised figures typically appear the following spring. FY 2025 was revised effective April 28, 2025. FY 2026 was revised effective May 21, 2026, covering seven markets.
The FY 2025 cycle is the instructive one. As originally published on August 14, 2024, FY 2025 would have cut New York’s FMRs below the prior year. Reevaluation reversed it: the revised notice raised FMRs for New York City, Boston and several other areas, effective April 28, 2025 (Federal Register FR-6479-N-02, 90 FR 14158, March 28, 2025). A flat or declining initial publication is not the end of the process.
The FY 2026 cycle showed something further, and it is the part most owners miss. A reevaluation does not adjust one year and expire. It resets the base that every subsequent year is built from.
Los Angeles is the clearest illustration. Its FY 2026 SAFMRs were revised upward last May, and HUD then calculated FY 2027 from the corrected figures. Measured against that revised base, Los Angeles looks like a market that barely moved this year — up 2.5 percent. Measured against what HUD originally published for FY 2026, the same ZIP codes are up 13.8 percent. Asheville reads +6.6 percent against its revised base and +19.5 against the original. Napa reads +7.2 and +20.0.
The difference in each case is the reevaluation, carried forward. Those markets did not get a one-year adjustment that lapsed; they got a permanently higher starting point, and the compounding runs from here.
The pathway has real constraints. It is initiated by the housing authority rather than by owners, and it runs in two stages: the October 1 deadline is for the request, with the local rental market survey after. In FY 2026, thirteen requests covering fifteen areas produced eleven HUD found valid, of which seven ultimately submitted survey data. The survey cost sits with the PHA. And every FY 2026 revision moved upward, which is a selection effect rather than a statement about market direction — only areas that believe they are understated go to the expense of surveying.
Where to look
The FY 2027 data is live on marketrent.us. MarketRent is built as an app rather than a website — it runs in any browser, but it's made for a phone.
The SAFMR heat map covers every ZIP code in the country and returns Small Area Fair Market Rents by bedroom count alongside the year-over-year change. The calculator does the same for a single ZIP and computes the 150 percent threshold, so you can see where the line falls for a specific property rather than for a metro. There are two, one for each fiscal year — FY 2027 for anything renewing on or after October 1, FY 2026 for what is in effect until then.
Both are free and both sit behind a MarketRent™ account, which also opens the market briefs.
There is also Ask MarketRent, which answers questions against everything published here and points to the underlying analysis. If you want to know what happened in a particular ZIP code or metro this year, that is the fastest way to find out.

Two owners can look at the same September release and be in opposite positions — one whose contract has drifted above what the market supports, one whose benchmark stalled while the market kept moving. The published federal data will not tell either of them which one they are. That is what a study is for.
Pulse — What We're Tracking
FY 2027 opens on a stopgap. The President signed H.R. 6500, the Continuing Appropriations and Extensions Act, 2027, on September 2, funding federal agencies through December 11 at FY 2026 levels. Section 8 contract renewals continue uninterrupted, which is the immediate answer most owners want. The longer answer is that the actual FY 2027 decision now lands in a lame-duck session after the November midterms, so anyone modeling a renewal that closes in the first quarter is working against a funding level that has not been set. White House — H.R. 6500 signed into law
Project-based assistance is holding its ground. HUD is funded through the annual Transportation, Housing and Urban Development appropriations bill — THUD, in the shorthand everyone in Washington uses. The House version for FY 2027 runs about eight percent below the FY 2026 enacted level for HUD overall and cuts or freezes most program lines, but it increases project-based rental assistance by $432 million. In a shrinking bill, project-based assistance is among the few accounts moving up. The Senate has not released its version, so this is a signal rather than an outcome — but it is the signal this readership should be watching. Bipartisan Policy Center — FY2027 HUD Appropriations Tracker
The 2027 OCAF has not published. Operating Cost Adjustment Factors normally appear in the fall for a February effective date, but the 2026 factors slipped to February 3 after last year’s shutdown, and a stopgap running to December 11 creates the same conditions. Owners building renewal budgets on an assumed January factor should hold that assumption loosely. The 2026 national average was 5.1 percent; Ohio was 4.9. Federal Register — Operating Cost Adjustment Factors for 2026
Eve Moss is the founder of Clarendon and editor of MarketRent™. The MarketRent™ Monthly, with current market rents across all five regions, publishes later this month.


Archive • About • Tools • Services •Contact
About Clarendon: Clarendon is a commercial real estate advisory firm specializing in affordable and multifamily housing — providing brokerage, valuation, HUD Rent Comparability Studies, market studies, and appraisals for owners, investors, housing authorities and agencies nationwide.
© 2026 The Clarendon Group, Inc. All Rights Reserved. Disclosure