


National apartment rents edged up 0.4 percent over the year in July, holding near $1,808, while occupancy eased about half a point to 94.2. That small divergence — rents rising as buildings grow slightly emptier — is the quiet national signature of supply beginning to outpace demand: occupancy softens first, rents follow later. The headline numbers barely moved. But beneath them sits a five-year story that explains where rents are rising today and where they are falling — and it begins, as these stories usually do, with supply.
The Building Wave
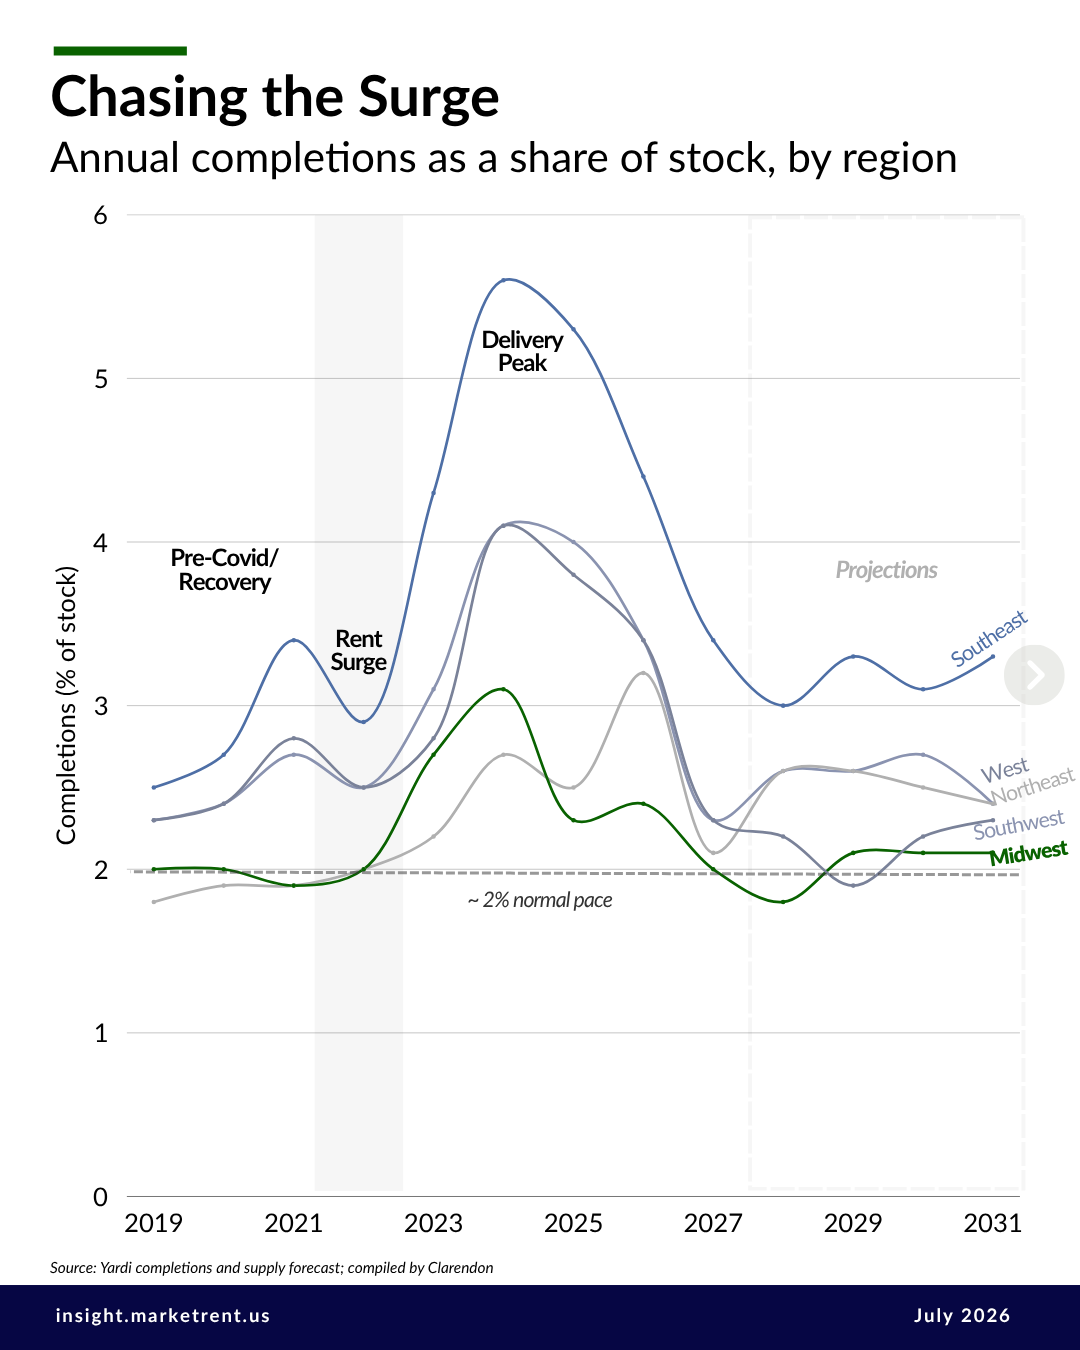
Start with what developers built, because it drives everything else. A normal year adds roughly 2 percent of existing stock in new apartments — the steady, long-run pace for most markets. When rents surged in 2022 — the Southeast up 16 percent, the West and Southwest above 13 — developers did what the signal told them to do: they built well beyond that pace. But apartments take years to deliver, so the construction the 2022 surge triggered did not arrive until 2023 and 2024. The chart shows the chase plainly. Completions in the Southeast climbed from under 3 percent of stock to 5.6 percent by 2024 — nearly triple the normal rate; the West and Southwest followed to roughly 4 percent. The Midwest never joined — its completions held near the 2 percent baseline the entire period and never once exceeded 3.1. Now the wave is cresting: the forecast shows deliveries receding across every region through 2031, but the damage to rent growth in the overbuilt regions is already done, and the Midwest's discipline is projected to continue.
The Surge That Reversed
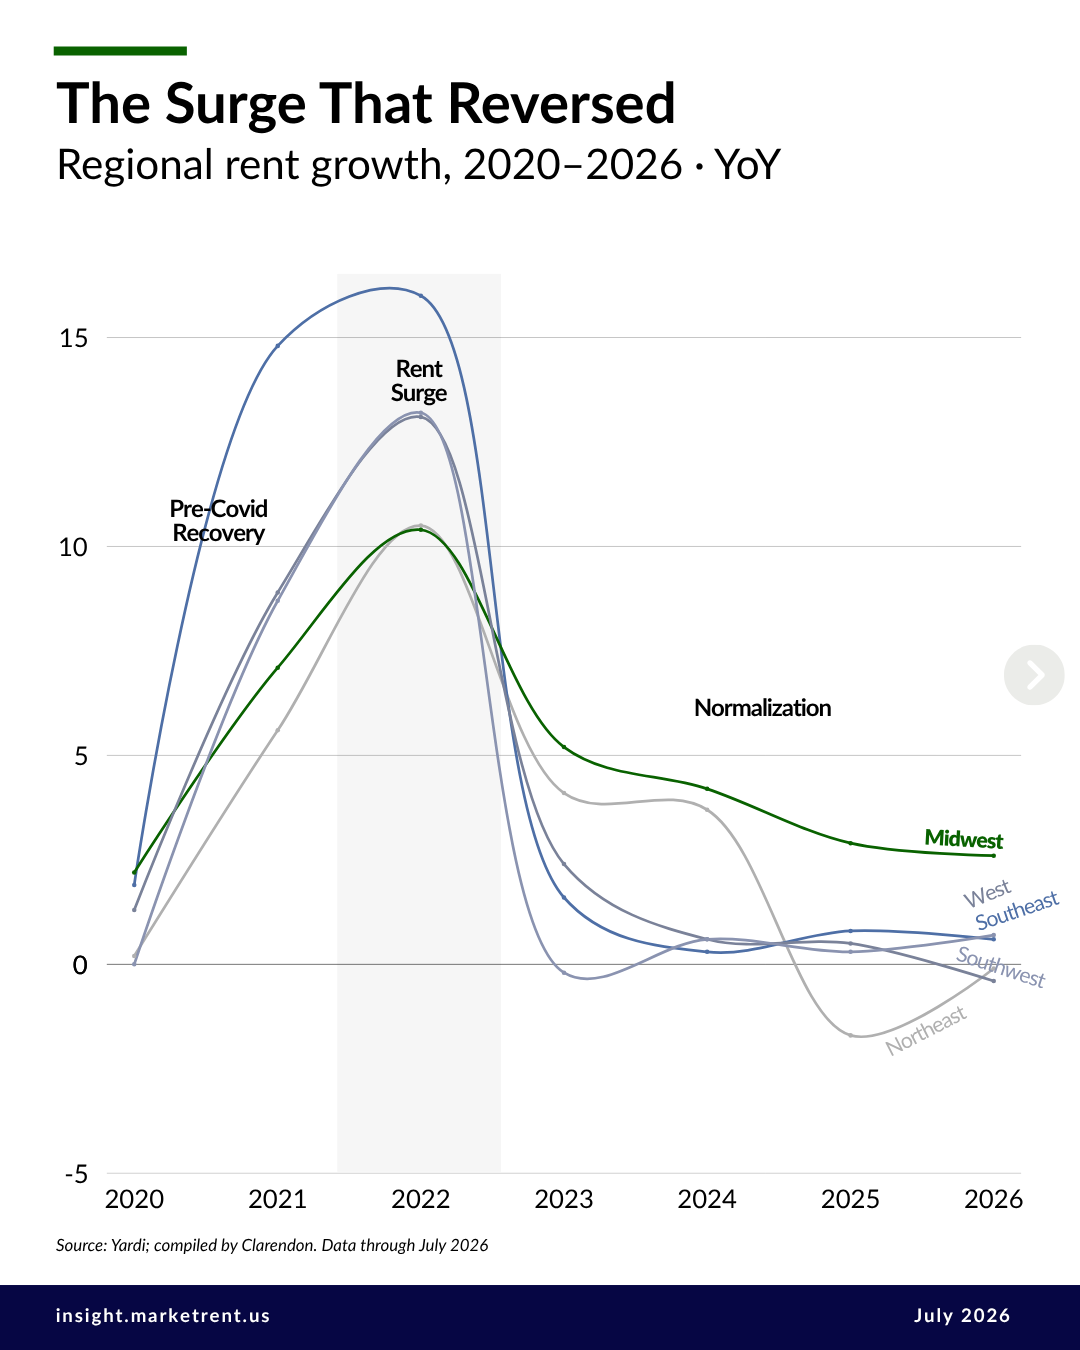
Rent growth is the mirror image of that supply wave, offset by about two years. Every region surged in 2021 and 2022, but the ones that spiked hardest gave the most back. Southeast rent growth ran to 16 percent in 2022, then collapsed to near zero by 2024 as its delivery wave landed. The West and Southwest followed the same path — steep spike, hard fall. The Midwest, which peaked most modestly at just over 10 percent, decelerated gently and still posts the strongest rent growth in the country. Place the two charts side by side and the mechanism is unmistakable: rents surged, supply chased two years later, and rents corrected wherever that supply arrived. The regions that chased the surge built their own correction. The one that didn’t kept its rent growth intact.
That is the engine of this market. The rest of the month’s data is the latest reading of it.
Rent Growth by Region, Now
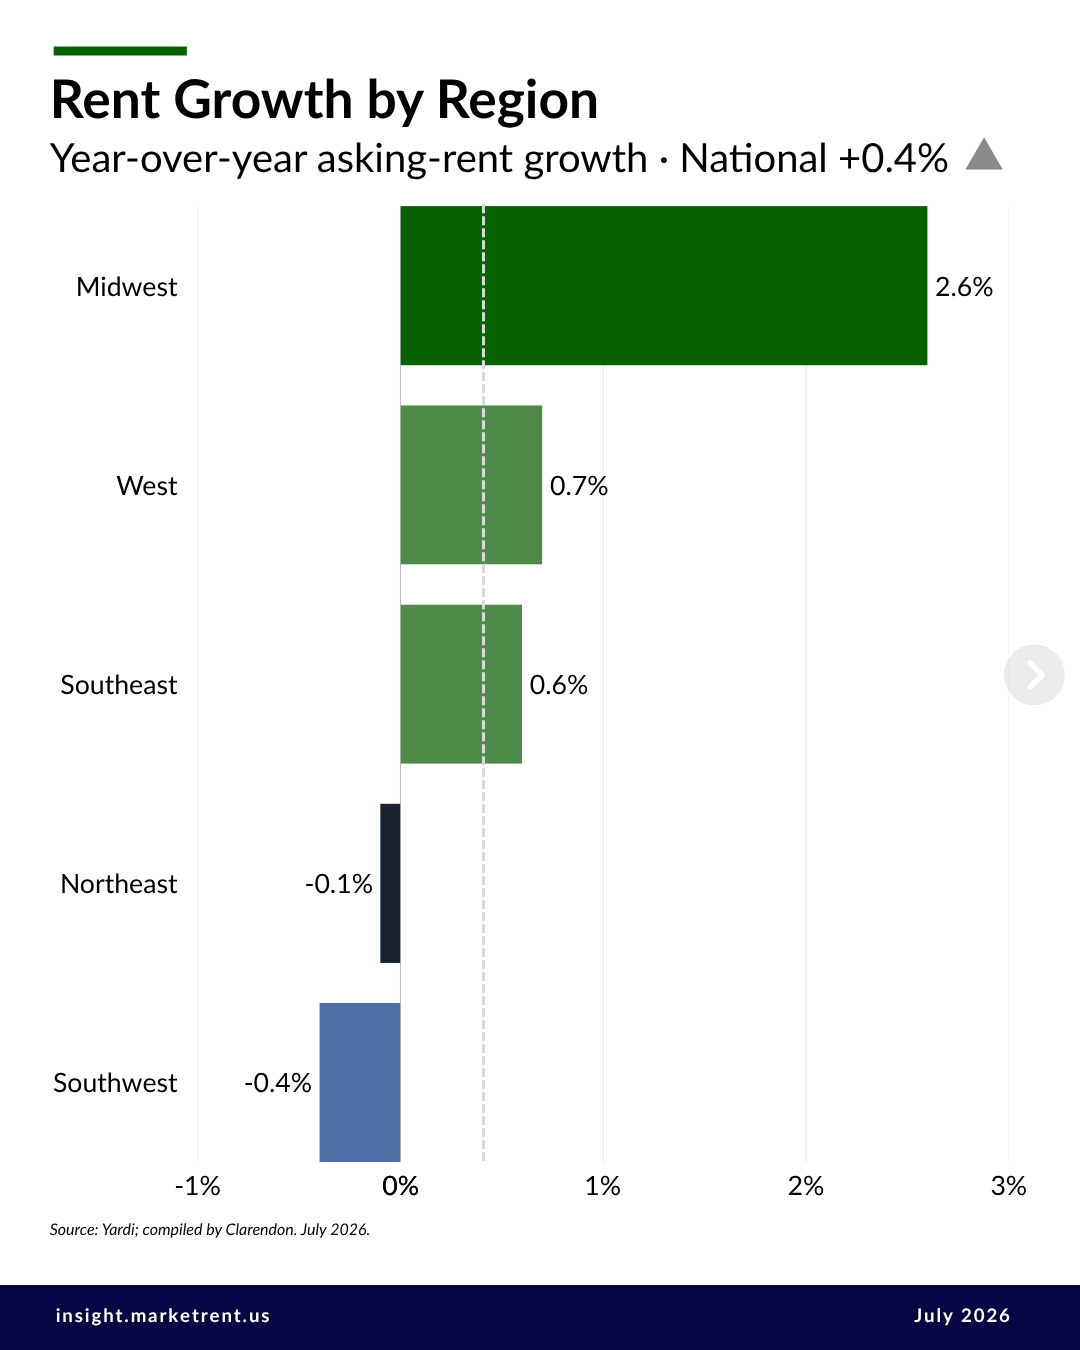
As of July, the Midwest leads every region at 2.6 percent — more than six times the national rate. The West and Southeast sit near the national line at 0.7 and 0.6, while the Northeast and Southwest have slipped below zero, at −0.1 and −0.4. The ranking is exactly what the trajectories predicted: the disciplined region on top, the regions still absorbing their delivery waves at the bottom.
Rent Growth by Class
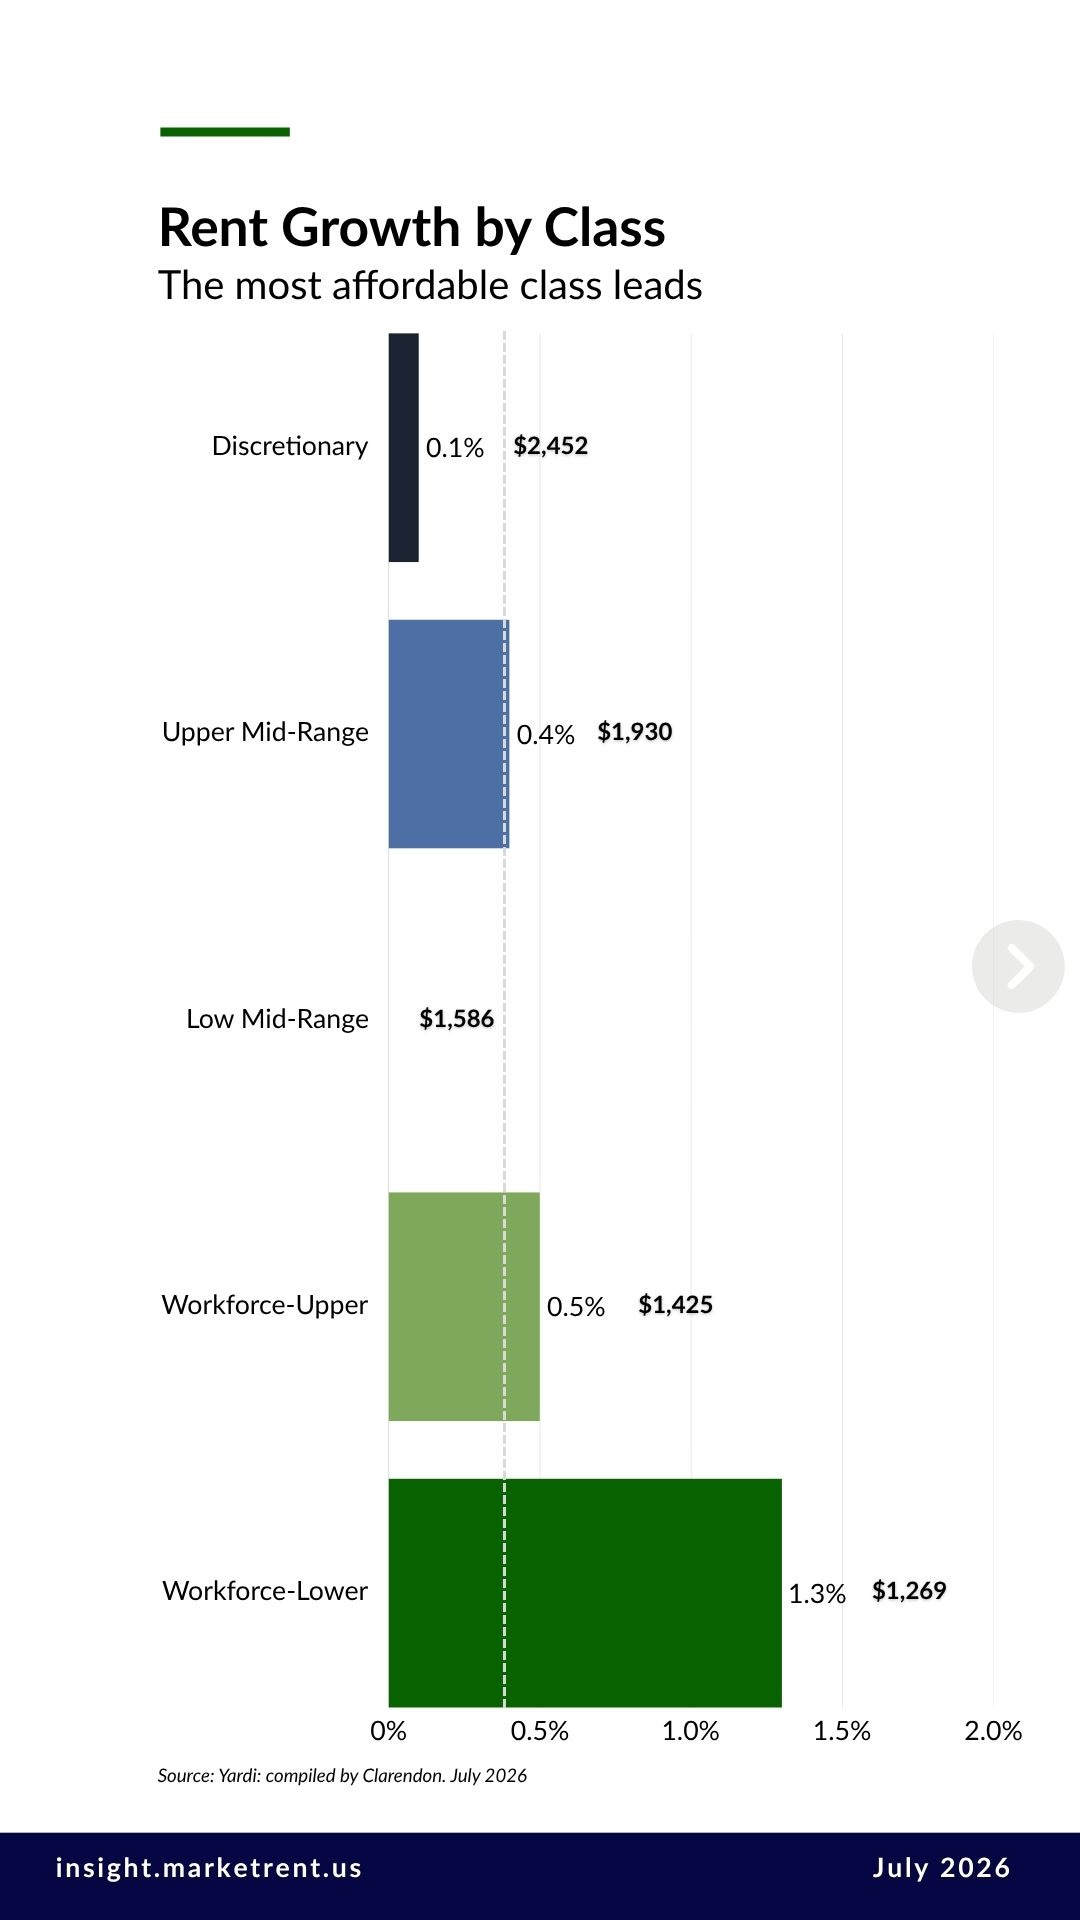
By asset class the national picture is quieter. The most affordable segment, Workforce-Lower, grew fastest at 1.3 percent. The other four classes sat within half a point of zero: Workforce-Upper at 0.5 percent, Upper Mid-Range 0.4, Discretionary 0.1, and Low Mid-Range essentially flat. At the national scale, class separates rent growth far less than region does. Where the class gap does open up, it tends to open locally, in metros where new construction has landed almost entirely at the top of the market and the affordable end has received almost none.
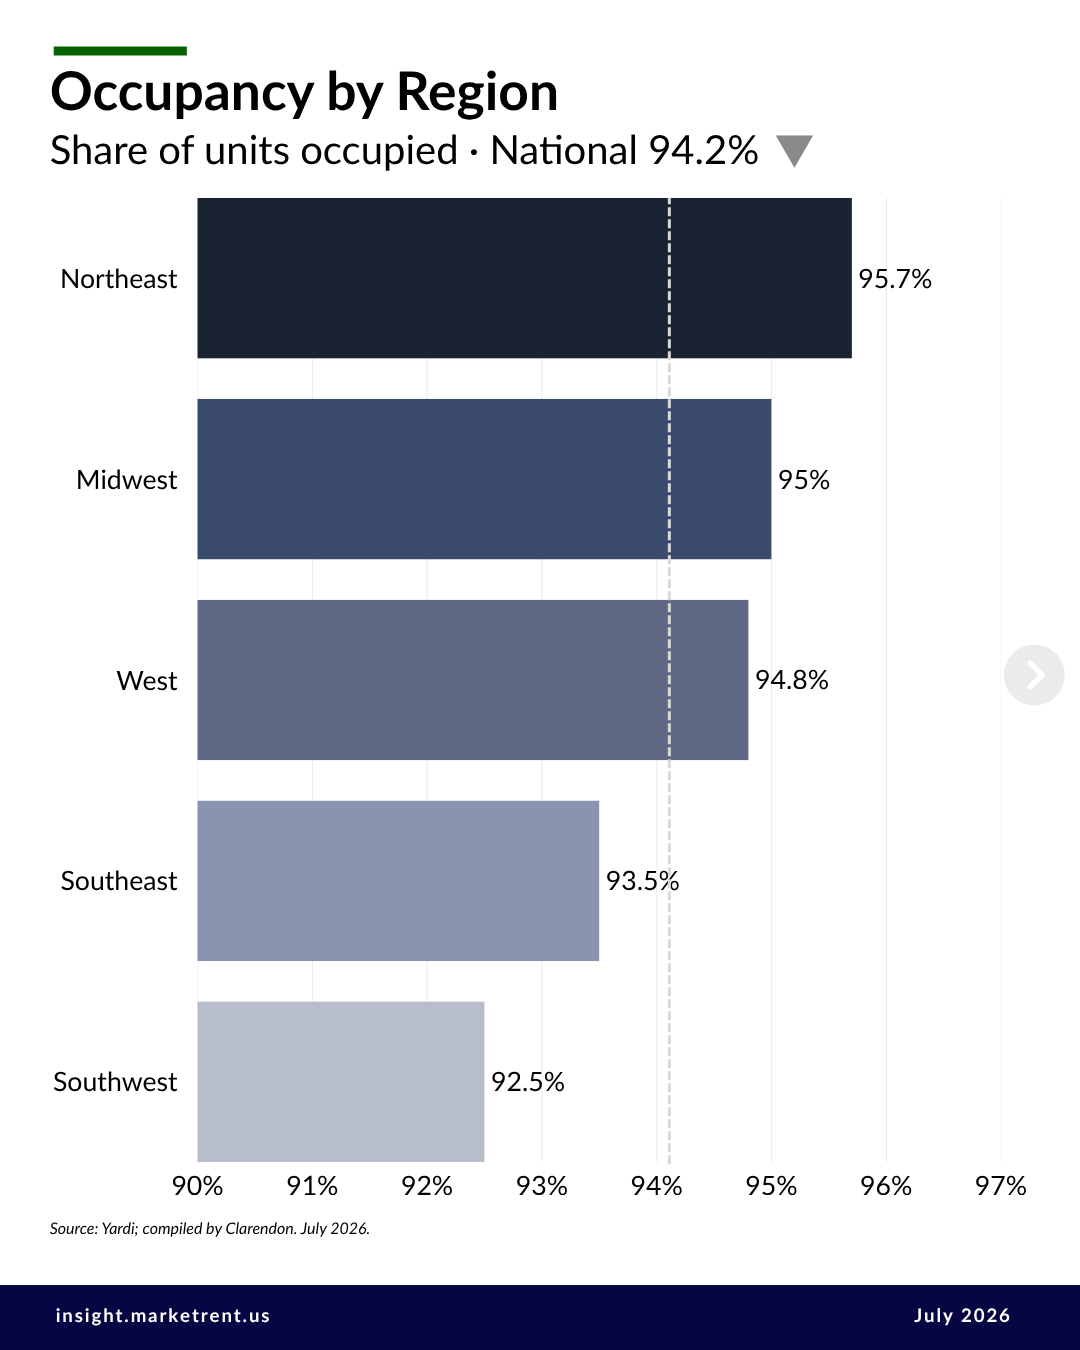
Occupancy
Occupancy sorts the same way and confirms the read. The Northeast is tightest at 95.7 percent and the Southwest softest at 92.5 — the same Southwest posting the steepest rent decline. Where occupancy runs high, supply is scarce and rents hold; where it has softened, deliveries have outpaced demand.
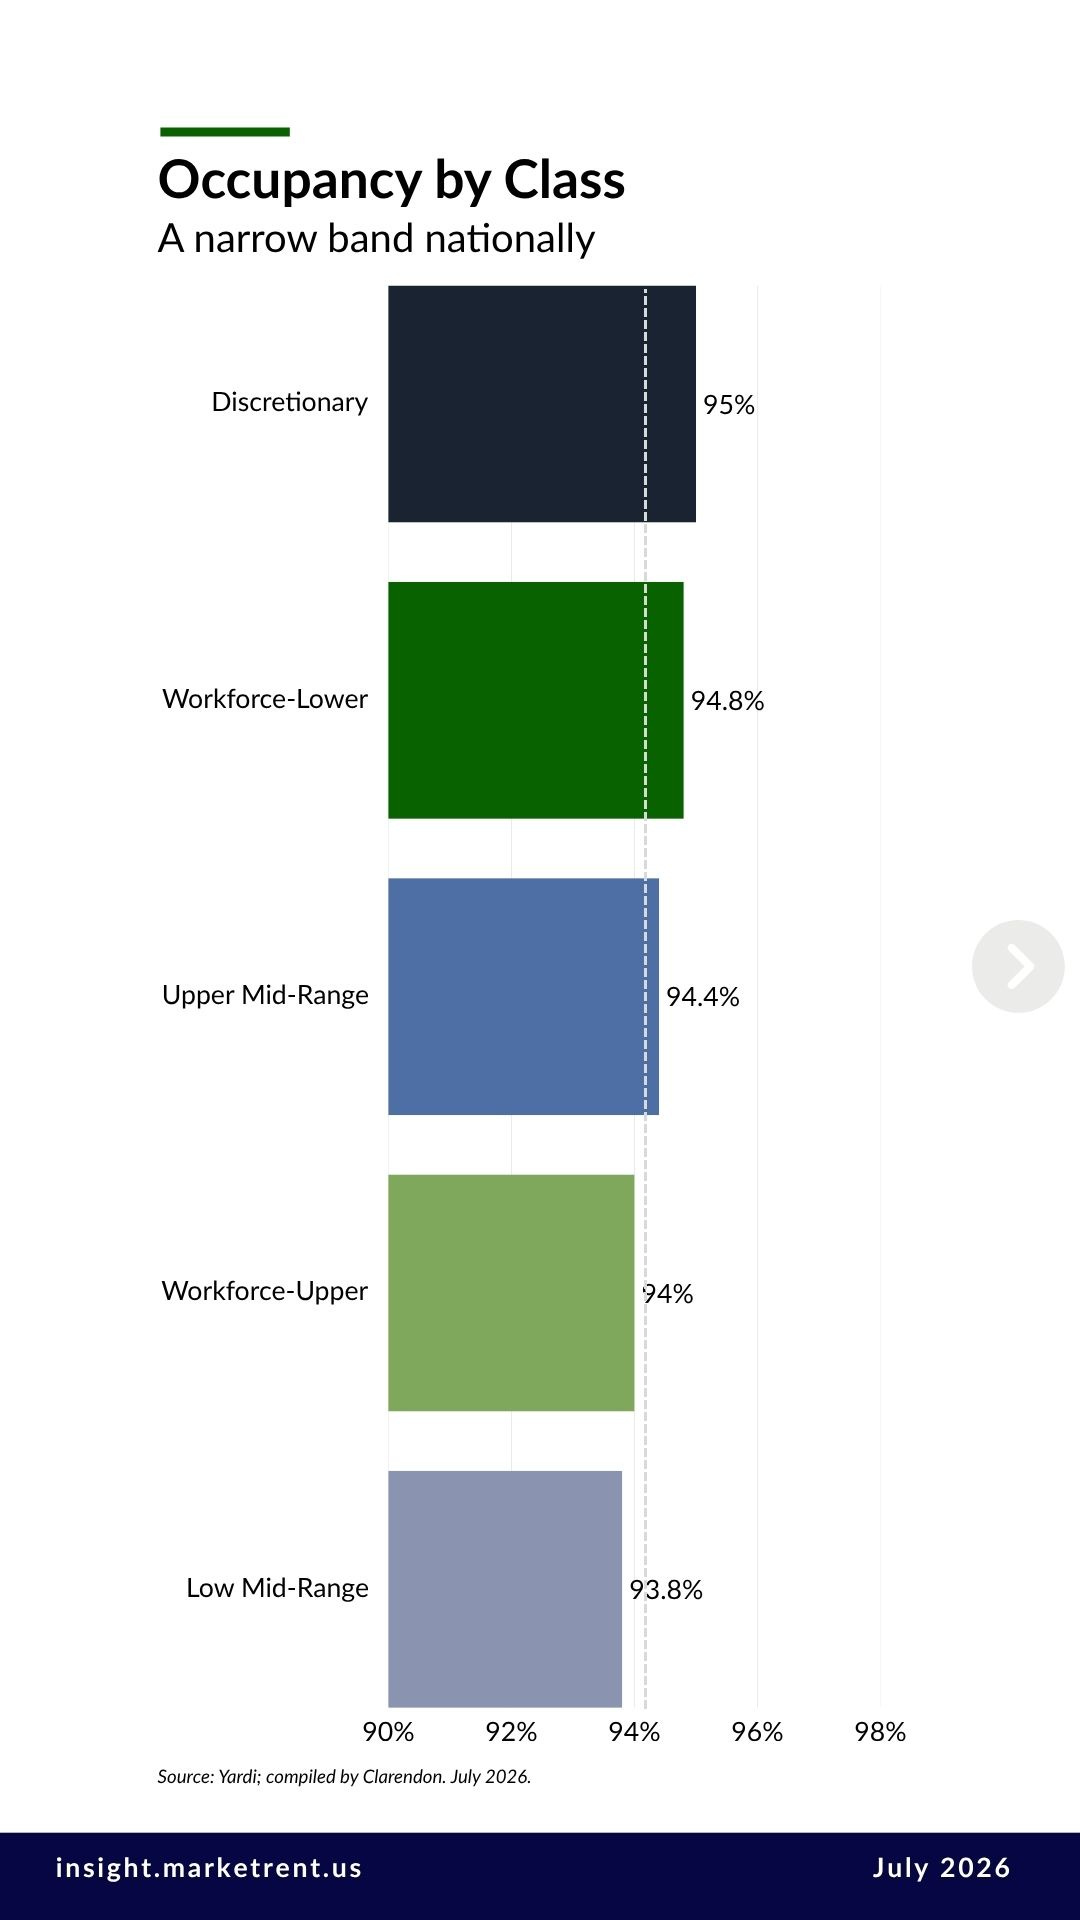
By class, national occupancy sits in a narrow band, from 93.8 percent in Low Mid-Range to 95.0 in Discretionary, with Workforce-Lower at 94.8. Nationally, the class divide shows up in rent growth more than in occupancy. Occupancy leads rent, so the soft spots today — the Southwest above all — mark where rent has further to fall.
What It Means
Three time horizons, one conclusion. The building wave shows what happened — supply chased the 2022 surge and corrected it. The rankings show where that has left each region today.
The forecast shows it continuing, with the Midwest’s pipeline the thinnest of any region. Across all three, the variable is supply, not demand: national occupancy has barely moved, so the regions pulling apart are pulling apart on how much was built and how much is still coming. The rent growth is where the supply isn’t — it was true five years ago, it is true this month, and the pipeline says it will be true for years yet.
For questions on this report, contact Eve Moss, founder of Clarendon and editor of MarketRent™
Data: Yardi Matrix, asking-rent basis; data through July 2026, subject to revision as additional properties report. National and regional figures are unit-weighted across 188 Yardi markets and compiled by Clarendon; this weighting is why the national average differs from Yardi’s published national figure. Regional groupings follow the five-region structure used by HUD’s Office of Multifamily Housing (Northeast, Southeast, Midwest, Southwest, West); markets are assigned by primary state. Class figures are national, from Yardi Matrix data by property asset class. Supply: Yardi Matrix completions history (2019–2026) and six-year forecast (2027–2031).
Pulse — What We're Tracking
The RAD cap rises — and RAD becomes permanent. The new housing law lifts the Rental Assistance Demonstration cap by 100,000 units, from 455,000 to 555,000, and makes the program permanent by removing its sunset date, while codifying existing resident protections in statute. For public housing authorities, that’s a clearer runway to convert aging public housing onto the Section 8 platform — a more stable and financeable base for preservation, and the change many owners in this readership have been waiting on. In a Major Win for Housers, the ROAD to Housing Act Becomes Law — NAHRO
The cost squeeze is national, and it’s structural. LISC’s June report, The State of Affordable Housing, finds operating expenses at affordable properties up 35 percent per unit since 2018 — insurance alone up 110 percent, administration 51 percent — even as Yardi projects affordable starts falling to 68,000 units in 2026 and 51,000 in 2027. The mechanism applies to every owner: rising expenses compress net operating income, and compressed NOI pressures values and defers the capital reinvestment that keeps buildings sound. Fewer new affordable units, under more cost strain — the squeeze runs both ways. The State of Affordable Housing — LISC, June 2026
Opportunity Zones reset — and the map is being drawn now. The Opportunity Zone program is now permanent, and a new tract map takes shape this year: the nomination period opened July 1, governors submit eligible census tracts through the fall, and Treasury certifies the new OZ 2.0 designations in the fourth quarter, effective January 1, 2027. Eligibility is tighter than the 2017 map, so the tracts drawn this cycle will concentrate the next decade of OZ capital more narrowly. It matters here because OZ capital builds housing — HUD credits the program with roughly 313,000 units from 2019 to 2024, largely multifamily. For owners and developers weighing an acquisition or disposition in one of these corridors, the designations landing this fall are the variable to watch. Opportunity Zones Updates — HUD


Archive • About • Tools • Services •Contact
About Clarendon: Clarendon is a commercial real estate advisory firm specializing in affordable and multifamily housing — providing brokerage, valuation, HUD Rent Comparability Studies, market studies, and appraisals for owners, investors, housing authorities and agencies nationwide.
© 2026 The Clarendon Group, Inc. All Rights Reserved. Disclosure
The two year lag between the 2022 rent spike and the delivery wave it triggered is the mechanism worth sitting with. Developers built to a signal that had already peaked by the time supply actually landed, which means every region's current rent trajectory is really a lagged echo of a decision made under different conditions. That's a useful reminder for reading any fast moving market. The response to a shock and the shock itself rarely land in the same window, so a snapshot of what's happening now can just be someone else's delayed reaction to something that already ended.