



Each year, owners of project-based Section 8 housing receive an adjustment to their contract rents through HUD’s Operating Cost Adjustment Factor. It arrives as a single percentage, applied on the contract anniversary, and for most owners it is simply accepted as the number the year produced. This year the national average was 5.1 percent.
It is worth pausing on what that figure is, because its name is precise and easily missed. The Operating Cost Adjustment Factor or OCAF is a measure of operating-cost inflation. It is built from a basket of expense categories — electricity, natural gas, water and sewer, employee wages and benefits, insurance, property taxes, goods and supplies — weighted and calculated at the state level. It answers one question: how much more did it cost to operate the property this year than last. It is a careful, defensible answer to that question.
It is not, and was never intended to be, a measure of what rents did in the local market.
Those are two different numbers, and in any given year they can diverge sharply. Operating costs and market rents respond to different forces. Costs are driven by energy prices, labor, insurance, and tax assessments — largely regional and national pressures. Market rents are driven by local supply and demand: what is being built in the submarket, how fast it is absorbed, whether jobs are arriving or leaving, what comparable units actually lease for. The two can move together, or they can pull apart — and the Operating Cost Adjustment Factor reflects only the cost side either way. It is measuring one side of the ledger while the market moves on the other.
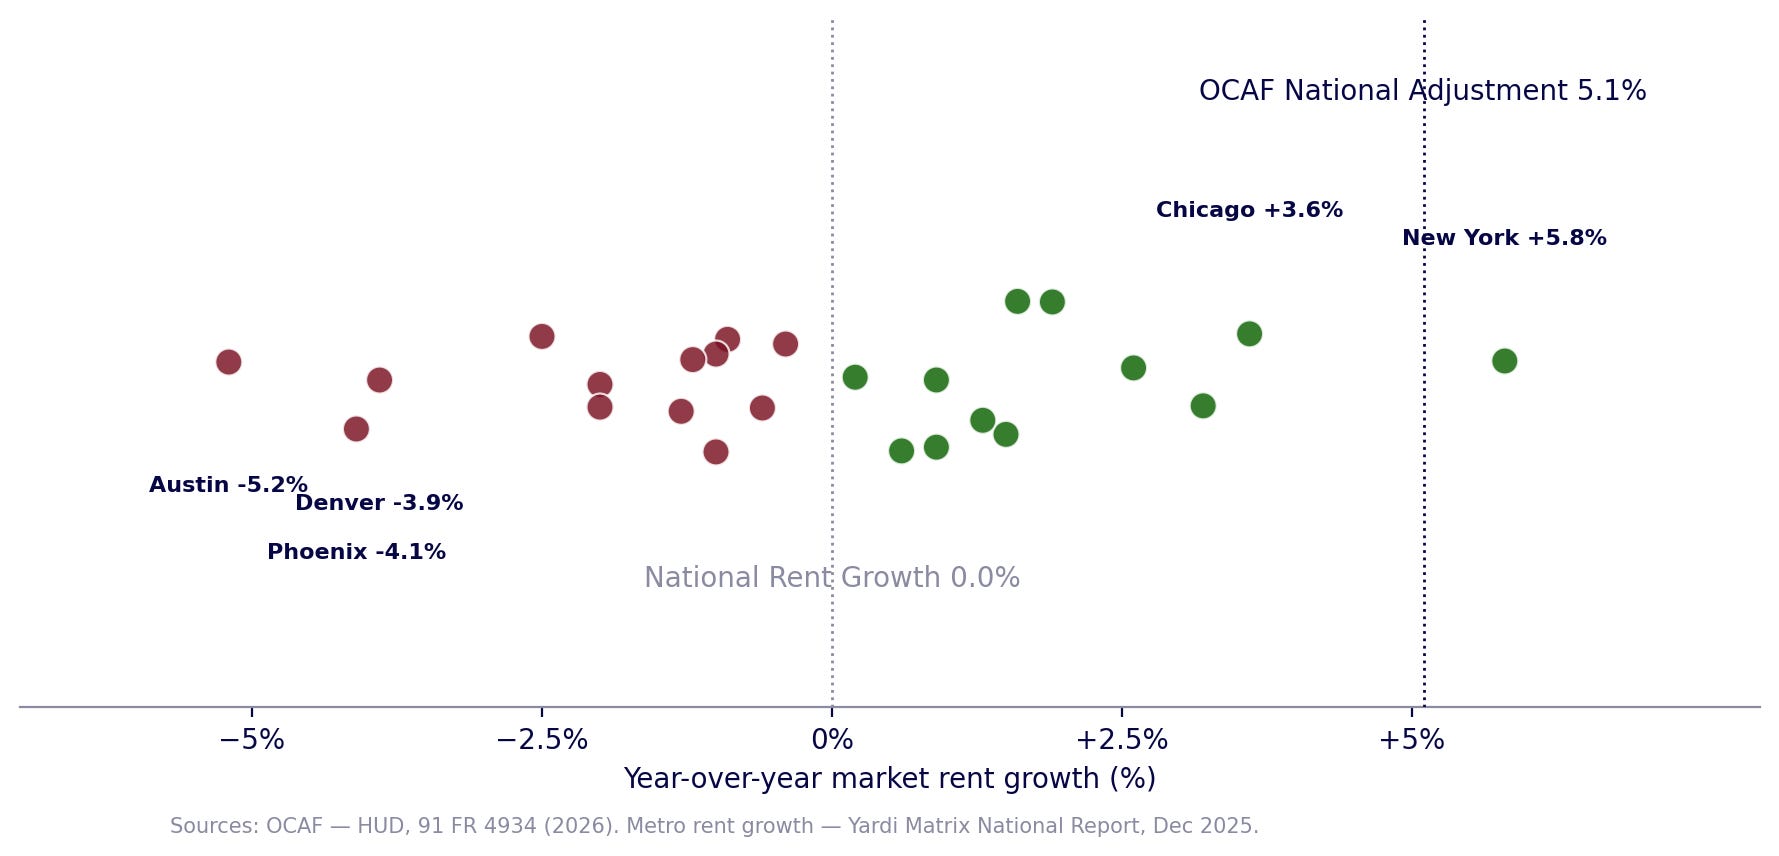
This year they pulled apart, and in a direction worth noticing. The cost adjustment averaged about 5 percent nationally. National market rents, by contrast, were essentially flat over the same stretch — advertised apartment rents ended 2025 at roughly zero percent year-over-year growth, the weakest showing in over a decade, as a record wave of new supply met cooling demand. So the cost side rose while the revenue side stood still. An owner reading only the 5 percent adjustment might reasonably assume the market had moved in their favor. In most places, it hadn’t.
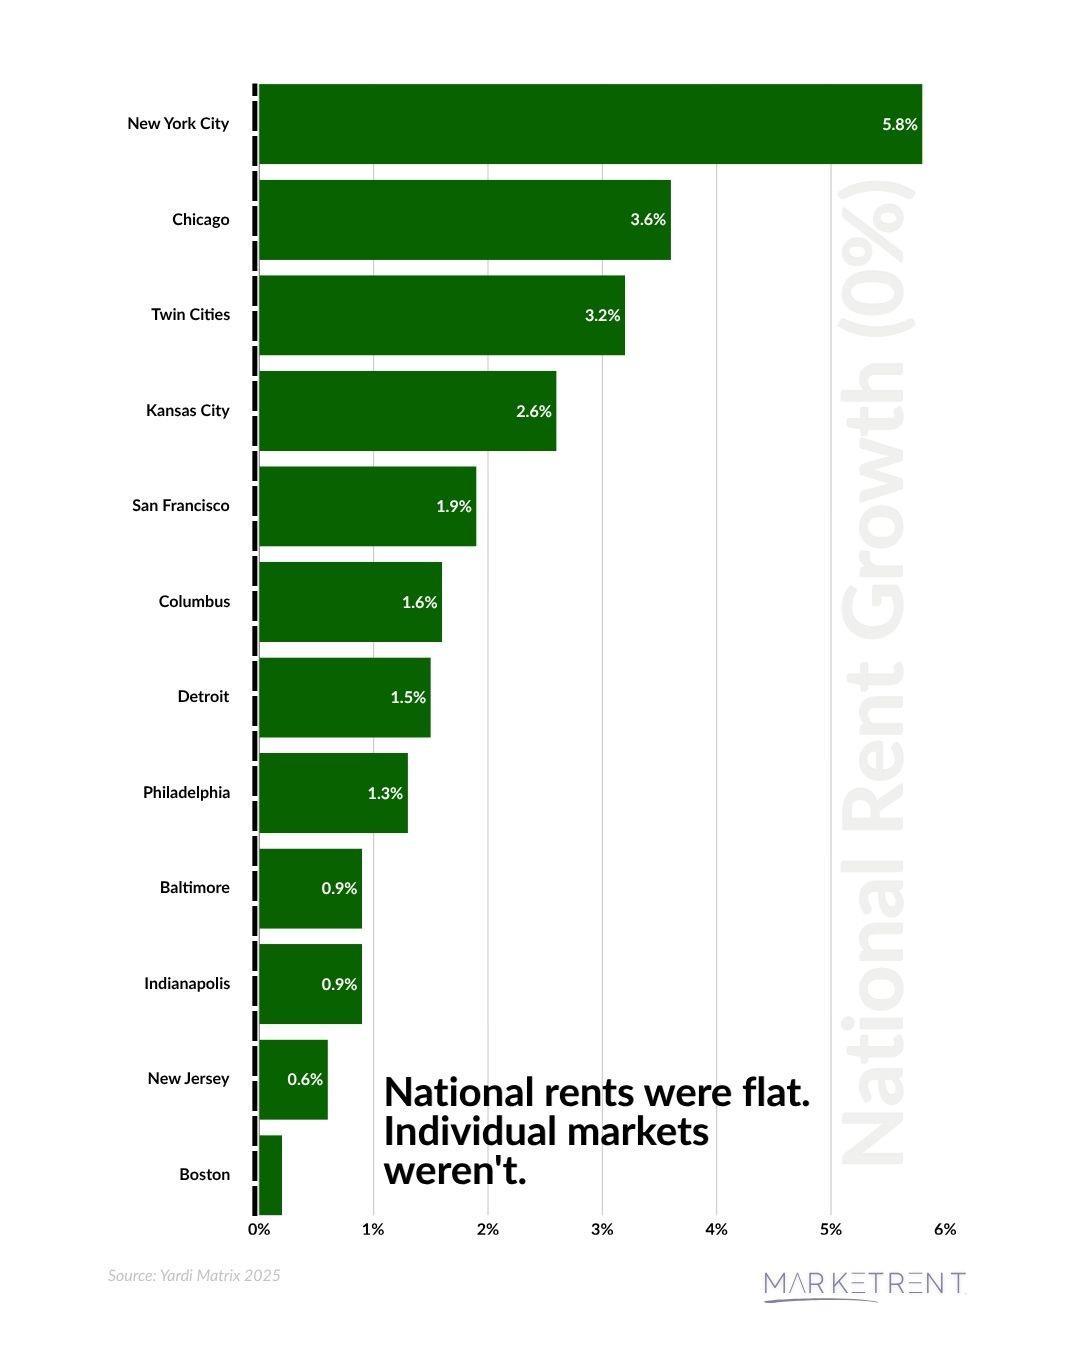
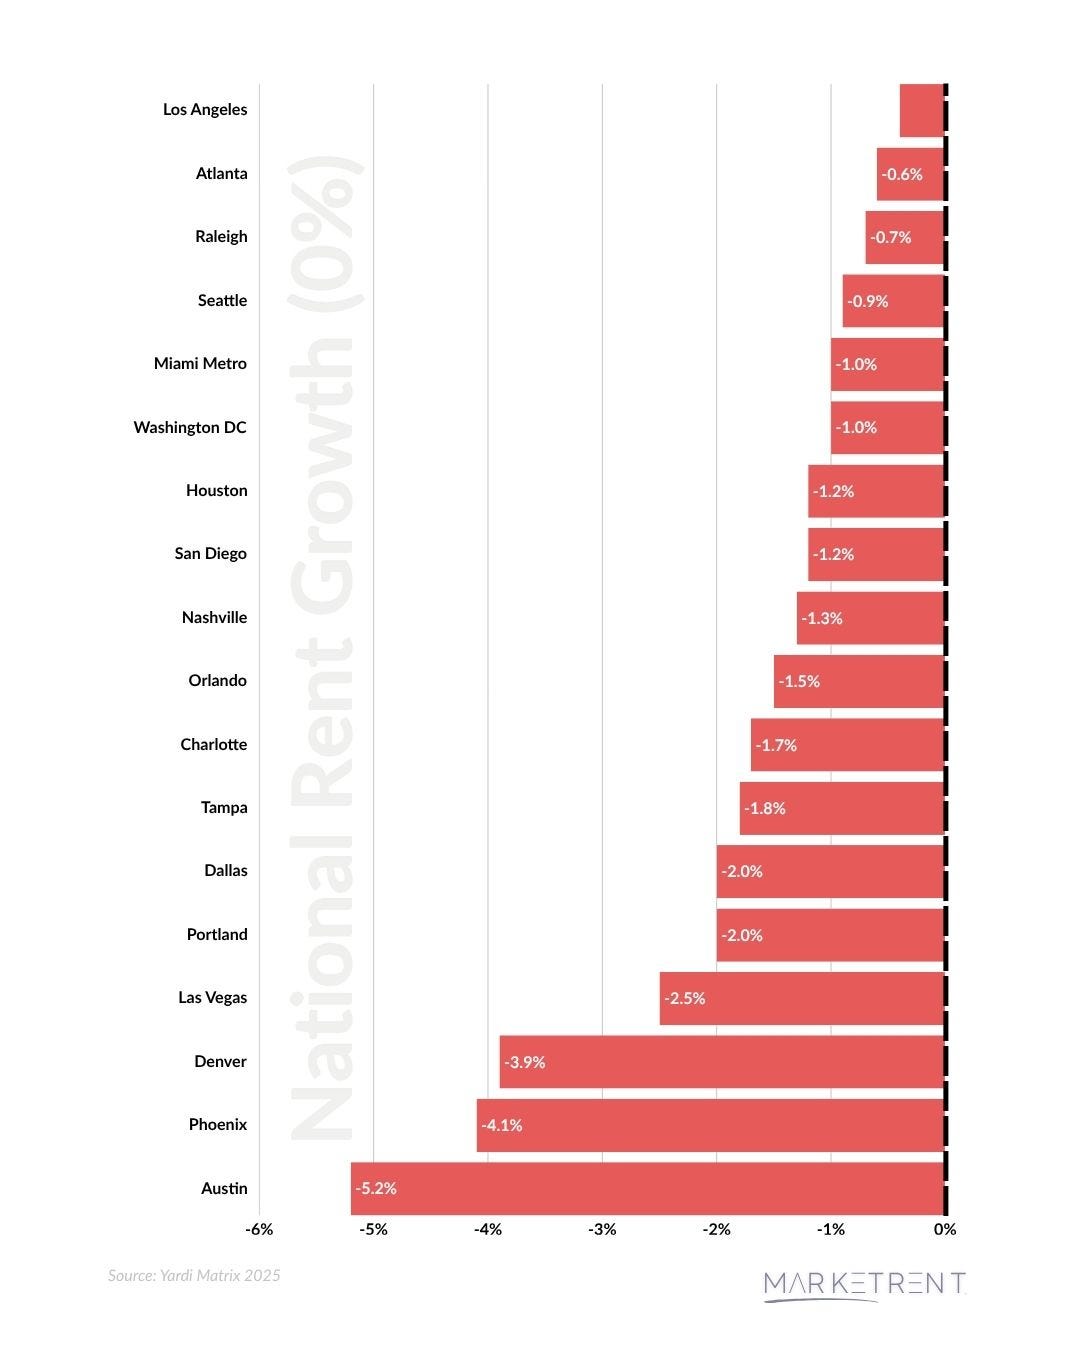
But “flat nationally” is itself an average concealing enormous variation — and this is the part that matters most for any single owner. Behind that roughly-zero national figure, some markets posted solid rent growth while others fell outright. Gateway and Midwest metros ran well ahead — New York up 5.8 percent year-over-year, Chicago 3.6 percent, the Twin Cities 3.2 percent — while much of the Sun Belt and West, still absorbing a glut of new deliveries, saw rents decline, with Austin down 5.2 percent, Phoenix down 4.1 percent, and Denver down 3.9 percent. The same year that produced flat national rents produced a nearly eleven-point spread between the strongest and weakest markets. The operating cost adjustment, calculated on cost baskets, reflected none of it. Every owner received a cost-based adjustment; what their market actually did was a separate question the factor never asked.
Flat nationally. Not anywhere in particular.
Year-over-year market rent growth, top 30 metros — a 0.0% national figure spans +5.8% to −5.2%
The variation in the cost factor itself only underscores the point. This year’s 5.1 percent national average concealed a wide range at the state level: from 3.3 percent in Maine to 9.8 percent in Louisiana among the states, with an outlier of 12.3 percent in the Virgin Islands. An owner’s actual adjustment depended entirely on which state’s cost basket applied — nearly a threefold difference for the same category of expense, in the same year. So the single number an owner receives varies wildly by geography on the cost side and bears no fixed relationship to what rents did on the market side. It is doubly removed from the specific question an owner actually needs answered: what would this property’s units command in its own market today.
One factor, fifty answers
FY 2026 OCAF by state — a 5.1% national average conceals a 3.3% - 12.3% range


There is also a timing gap built into the factor, and it is deliberate. The cost changes that feed the adjustment are measured on a lag — this year’s factor draws on tax data through early 2025, insurance figures comparing 2024 to 2023, and cost weights averaged over three years of audited financial statements, a method HUD uses expressly to smooth short-term swings. The result is stable, but it is not current: the adjustment an owner receives in a given year reflects a cost picture from roughly a year or more earlier. Market rents carry no such lag; they are repriced continuously against current demand — increasingly by revenue-management systems that adjust asking rates in near-real time. So the two figures are not only measuring different things — costs versus rents — they are moving on entirely different clocks: one smoothed and backward-looking, the other immediate and forward-looking. Part of why this year’s cost factor sits near 5 percent while market rents are flat is precisely that decoupling: the factor still reflects elevated operating costs and the tail of an earlier surge, while asking rents have already flattened in response to current supply and demand. In a heating market the gap can run the other way, with asking rents climbing well before the cost factor reflects anything. Either direction, the adjustment is anchored to smoothed, backward-looking cost data rather than to where the market is now.
That question has a defined instrument, and it is a different one from the cost factor. A Rent Comparability Study measures the market side — what comparable units in the same market actually rent for, established by a state-certified appraiser to HUD’s methodology. Where the annual cost adjustment tells an owner how their expenses moved, the study tells them where the market moved. That the two are distinct is not merely an outside observation: in this year’s notice, HUD itself asked the public how OCAF-adjusted rents have compared with the rents paid by recent movers into comparable units — an acknowledgment, in the agency’s own rulemaking, that the cost adjustment and the market are not the same measurement. In programs where an owner’s contract rents can be supported by demonstrated market rent, the study is how that case gets made — and in a market that has outpaced the cost adjustment, it can be the difference between rents set by a cost basket and rents set by the market itself.
None of this is a criticism of the cost factor. It does its job precisely; the annual adjustment is real and it matters. The point is narrower and more useful: it is one of two numbers, and it answers the cost question, not the market question. An owner who relies on it alone is measuring half the ledger. In a year when costs and rents happen to move together, the distinction is academic. In a year like this one — costs up around 5 percent, national rents flat, and individual markets ranging from strong growth to outright decline — the distinction is the whole story. Knowing which market you are in, and what your own units would actually command in it, is not something the annual factor can tell you. It is a different question, answered by a different instrument.
Related Resources
For why a required study’s outcome is not a foregone conclusion, see The Study Is Required. The Outcome Isn’t.
The Study Is Required. The Outcome Isn't.

A Rent Comparability Study is required at renewal. What it finds isn’t. Two appraisers working the same property and the same market can produce materially different conclusions — and both may satisfy HUD’s submission requirements. This article covers the three factors that consistently determine whether an RCS captures the full value the market support…
For how a phased approach fits contract timing, see Market Alignment with the Phased RCS Approach.

Pulse — What We're Tracking
The ROAD to Housing Act becomes law (enacted July 11, 2026) — The most significant federal housing package in decades is now on the books, and several provisions land on the affordable side of the ledger: the Rental Assistance Demonstration cap rises by 100,000 units with extended tenant protections, FHA multifamily loan limits are updated and their formula reformed, and environmental review is streamlined for qualifying developments. For owners and investors in assisted housing, the signal is directional — the federal posture is tilting toward preservation and supply — but the specifics will matter deal by deal.
The Fed holds, and the inflation read stays cautious (FOMC minutes, June 2026 meeting) — The minutes show a committee still watching inflation before easing — the backdrop for this issue’s point. The operating-cost pressures that drive the annual adjustment don’t move in isolation; they track the same inflation picture the Fed is weighing, and they don’t turn on a dime. When the macro read stays cautious, the cost side of an owner’s ledger tends to stay elevated even as local rent markets move on their own.
Builder sentiment stays weak on affordability (NAHB, July 2026) — Homebuilder confidence remains subdued as affordability pressures persist — a signal that the supply response has limits even where demand exists. It’s a useful counterweight to the rent data: the same affordability math that keeps renters in place also slows the new construction that would eventually ease it, and the markets absorbing the least new supply are the ones where rents held up best this cycle.


Tools • Services • Archive • About • Contact
About: Clarendon is a trusted partner for government compliance and advisory solutions, specializing in HUD-compliant services: brokerage, appraisals, rent comparability studies, market studies, inspections, facility support and strategic guidance for agencies, housing authorities and property owners nationwide.
© 2026 The Clarendon Group, Inc. All Rights Reserved. Disclosure