


For most of its history, Cleveland’s Land Bank waited. Lots sold when someone applied, usually one parcel at a time and often for a nominal price. That posture has changed. Over the past three years, the City has published land prices and begun matching parcels to programs. It has paired lots with landmark buildings in Central, started a housing innovation district on East 67th Street, and launched a pilot in St. Clair-Superior and Hough that transfers lots at a reduced fee and reimburses site preparation.
The newest piece is RFP 2026-GEN-1: 166 parcels in Ward 7, offered through a single competitive process that closed November 6. It sits at the opposite end of that toolkit from the East Side pilots, and the reason is the market around it.
Matching the Tool to the Market
The City sorts its blocks using the Neighborhood Development Index. Built with Case Western Reserve University’s Poverty Center and refreshed every two years, it grades census blocks on housing, market, and demographic measures. “Market Rate” areas show active development and rising rents and sale prices. “Opportunity” areas show lower values and incomes and need more help to attract investment. “Middle” areas sit between the two.
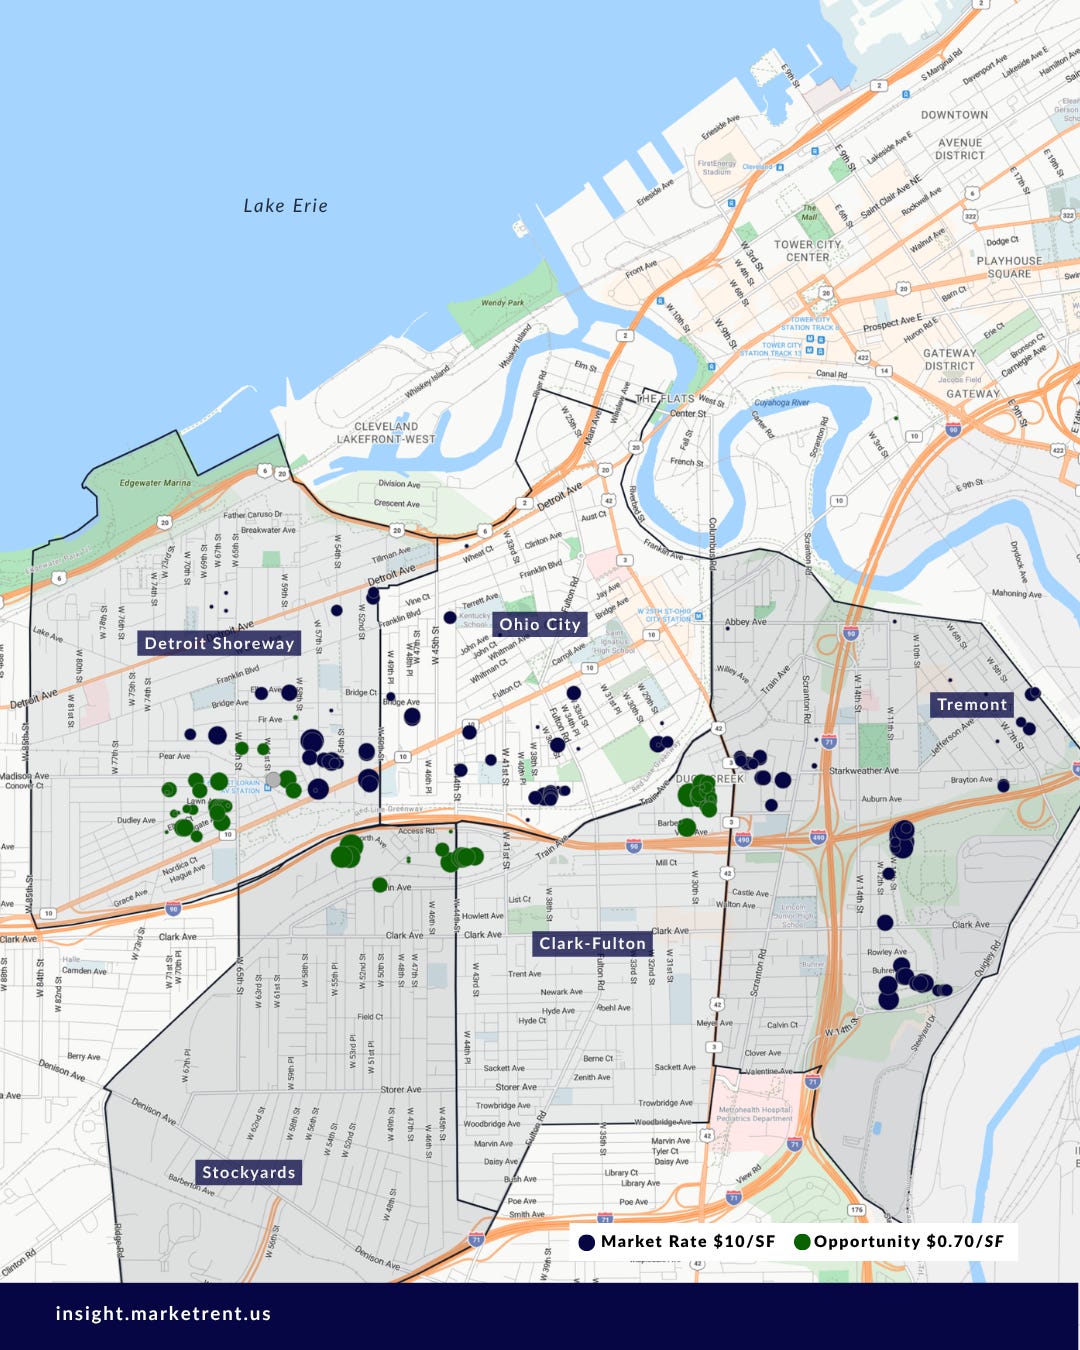
Those tiers now set two prices. Land Bank lots sell for $10 per square foot in Market Rate areas, $3 in Middle areas, and $0.70 in Opportunity areas. New-home tax abatements step up in the other direction, from 85 percent in Market Rate areas to 100 percent in Opportunity areas. In weaker markets, the City lowers costs and adds incentives. In stronger ones, it sells at a published price and asks the market to compete.
Ward 7 is mostly the second kind. Of the 166 parcels, 105 are Market Rate, and together they carry about 95 percent of the RFP’s land value on roughly 55 percent of its acreage. All of Tremont and Ohio City’s parcels sit on that side of the line. All of Clark-Fulton’s and Stockyards’ sit on the other. Detroit Shoreway is split down the middle. The City has said Market Rate proceeds are meant to support other goals, including affordable housing. Land in strong blocks helps pay for the work in the others.
What the Houses Say
The MLS data shows how far apart those two land markets really are. Over the past six months, existing single-family homes in Ohio City, Tremont, and Detroit Shoreway sold at a median of $372,000, or about $221 per square foot. Homes built since 2018 sold at a median of $559,000, about $300 per square foot. In Clark-Fulton, Stockyards, and the lower blocks of Detroit Shoreway, the median sale was $95,000, about $76 per square foot. None of those 59 sales was a home built in the last eight years.
The gap holds at the neighborhood level. Two RFP lots on West 47th Street in Detroit Shoreway are priced at $39,600 each, in a neighborhood where homes built since 2018 sold at a median of about $460,000 over the past six months. In Ohio City, nine RFP lots on West 36th through 38th Streets are priced between $12,000 and $52,000; new homes there sold at a median of $580,000.
What the Land Says
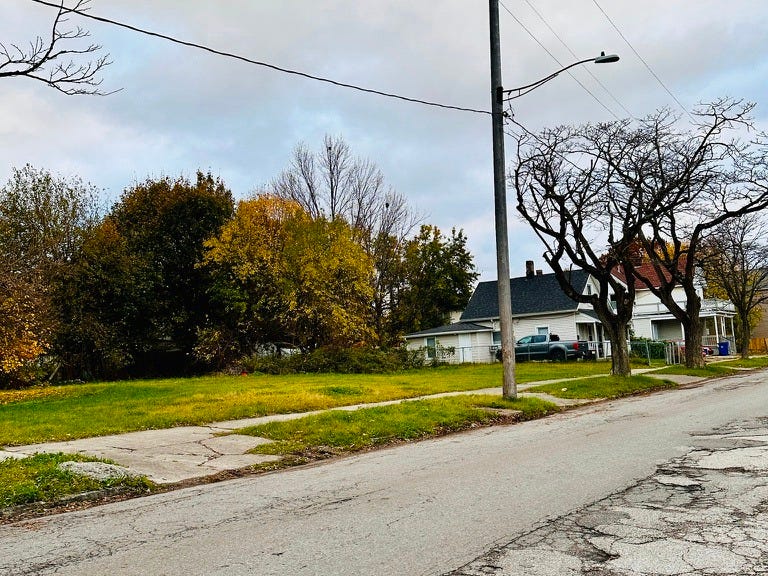
Vacant land trades thinly on the MLS. Over the past year, asking prices for lots in Ohio City and Tremont ran well above the City’s $10 schedule, and many listings expired unsold. The closings tell a quieter story. The few private lots that sold in Detroit Shoreway and Ohio City closed at or above what the City is asking for comparable parcels. In the blocks around the Opportunity parcels, the handful of private lot sales closed at roughly two to four times what a similar City lot costs at 70 cents a foot.
On both sides of the line, the City’s schedule sits at or below where private land has been closing. That is the space the RFP leaves for bidders. Fair Market Value is the floor, the bid carries 30 of 100 points, and the City notes that comparable sales are a compelling justification of price.
Two Different Questions
On the Market Rate side, the question is what a lot is worth above $10 a foot. At that rate, the typical 2,800-square-foot Market Rate lot costs about $28,000. Against a $559,000 median for new construction, the land is about 5 percent of the finished price. The real variables are construction cost, absorption, and the 85 percent abatement on the first $350,000 of value, which nearly every recent new build here has exceeded.
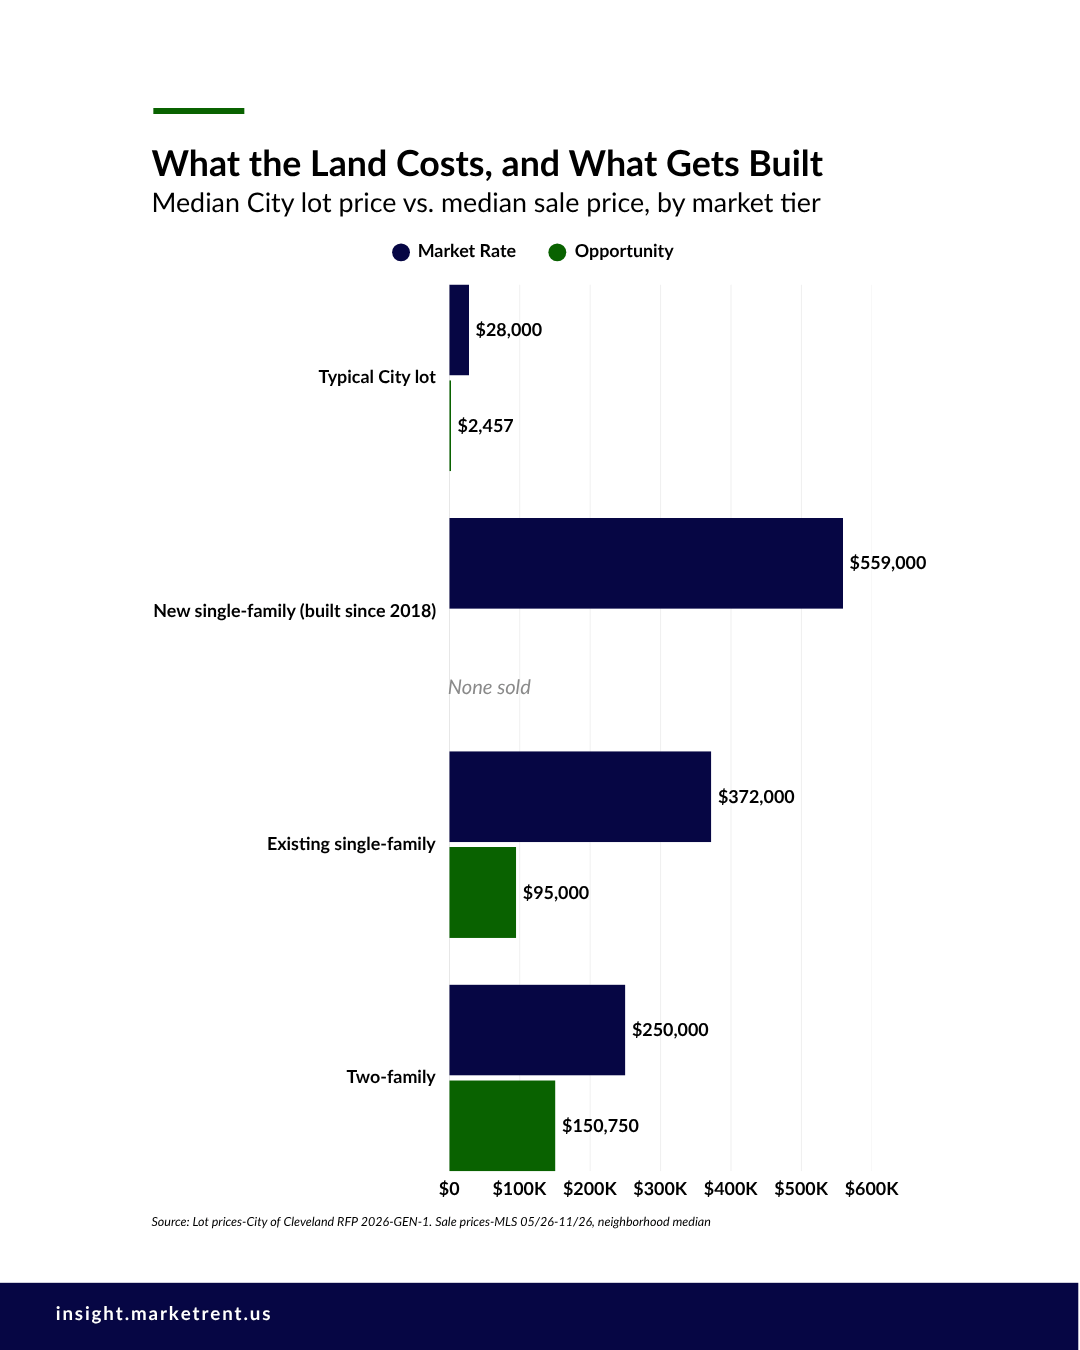
On the Opportunity side, the land is close to free, so its price rarely decides whether a project goes ahead. What decides it is the gap between what a new house costs to build and a resale market where the median recent sale is $95,000. It is the same gap CHN Housing Partners is closing with federal and Ohio housing tax credits for its planned 65 lease-purchase homes on former Land Bank lots in Clark-Fulton and Stockyards. It also explains why the City’s East Side pilots add site-preparation money on top of reduced land prices.
The Format Nobody Has Been Building
Of the 166 RFP parcels, 119 are zoned two-family, and the RFP prefers two-to-three-family density where possible. On the MLS, that is the format the near west side has not been producing. Over the past six months, 113 two-to-four-family buildings sold across these five neighborhoods. Every one was built before 1930. The only newer buildings of this type listed anywhere in the city over the same period were a few high-end listings in Tremont, and none of them sold.
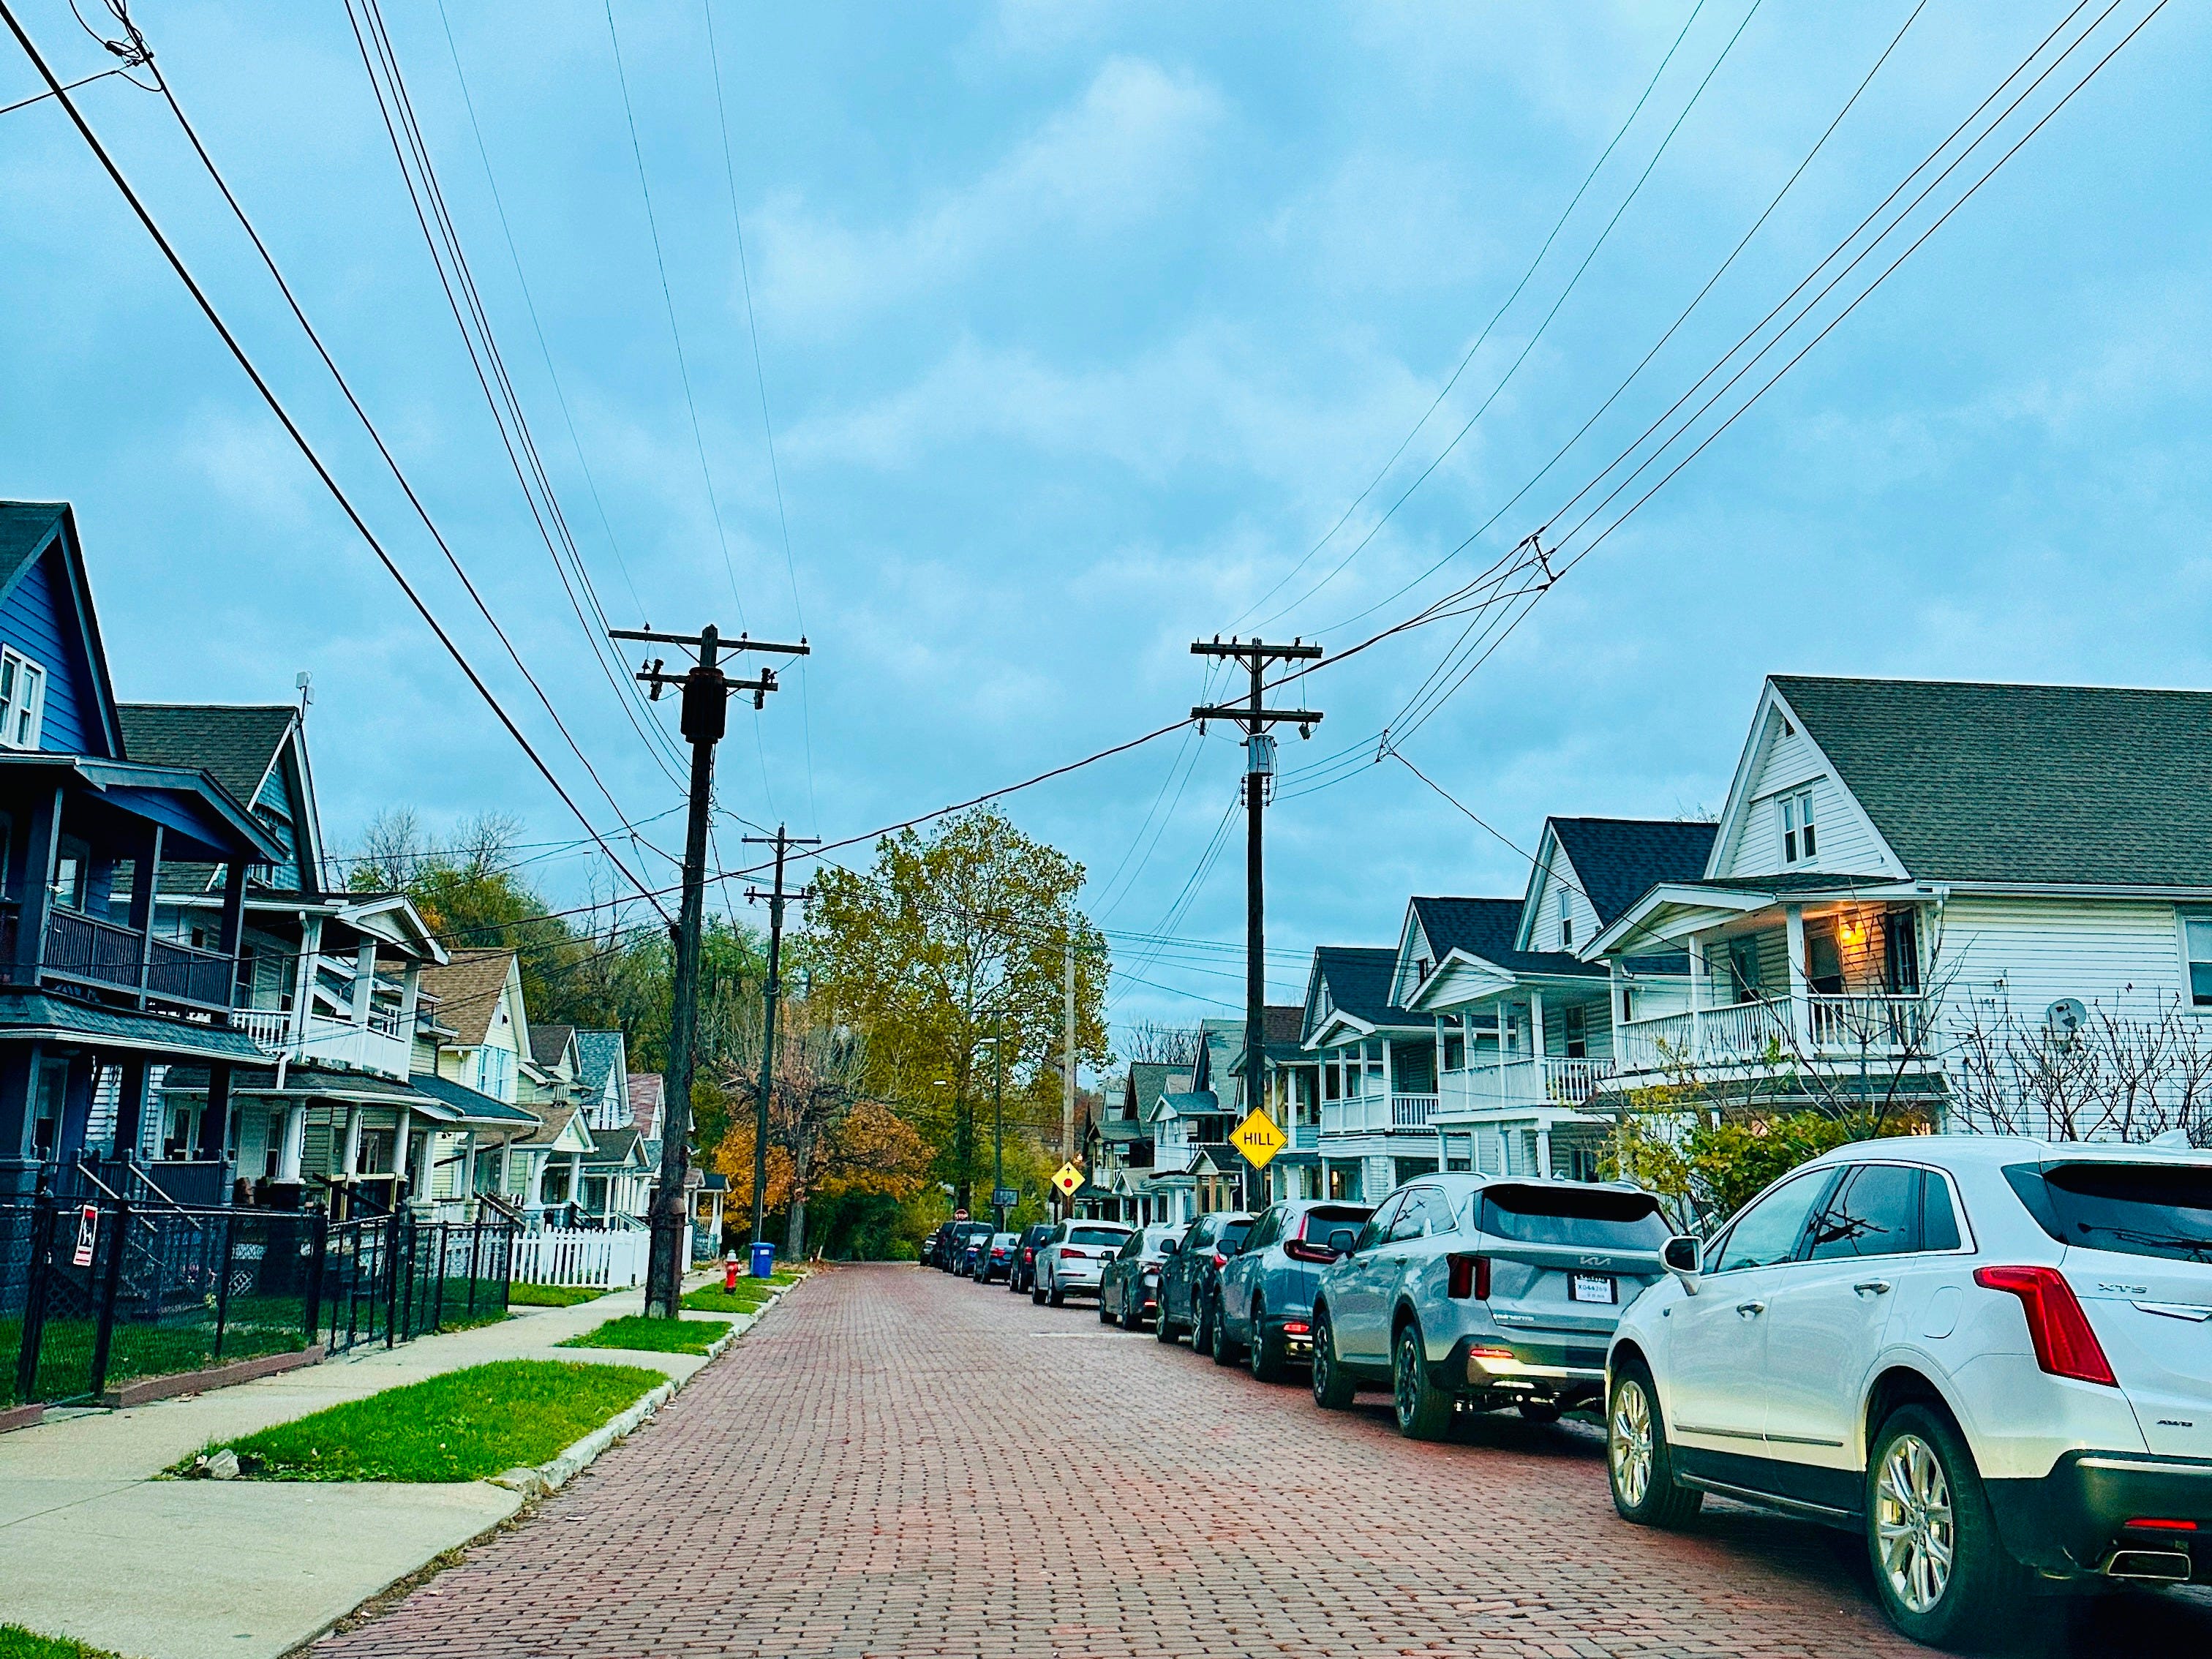
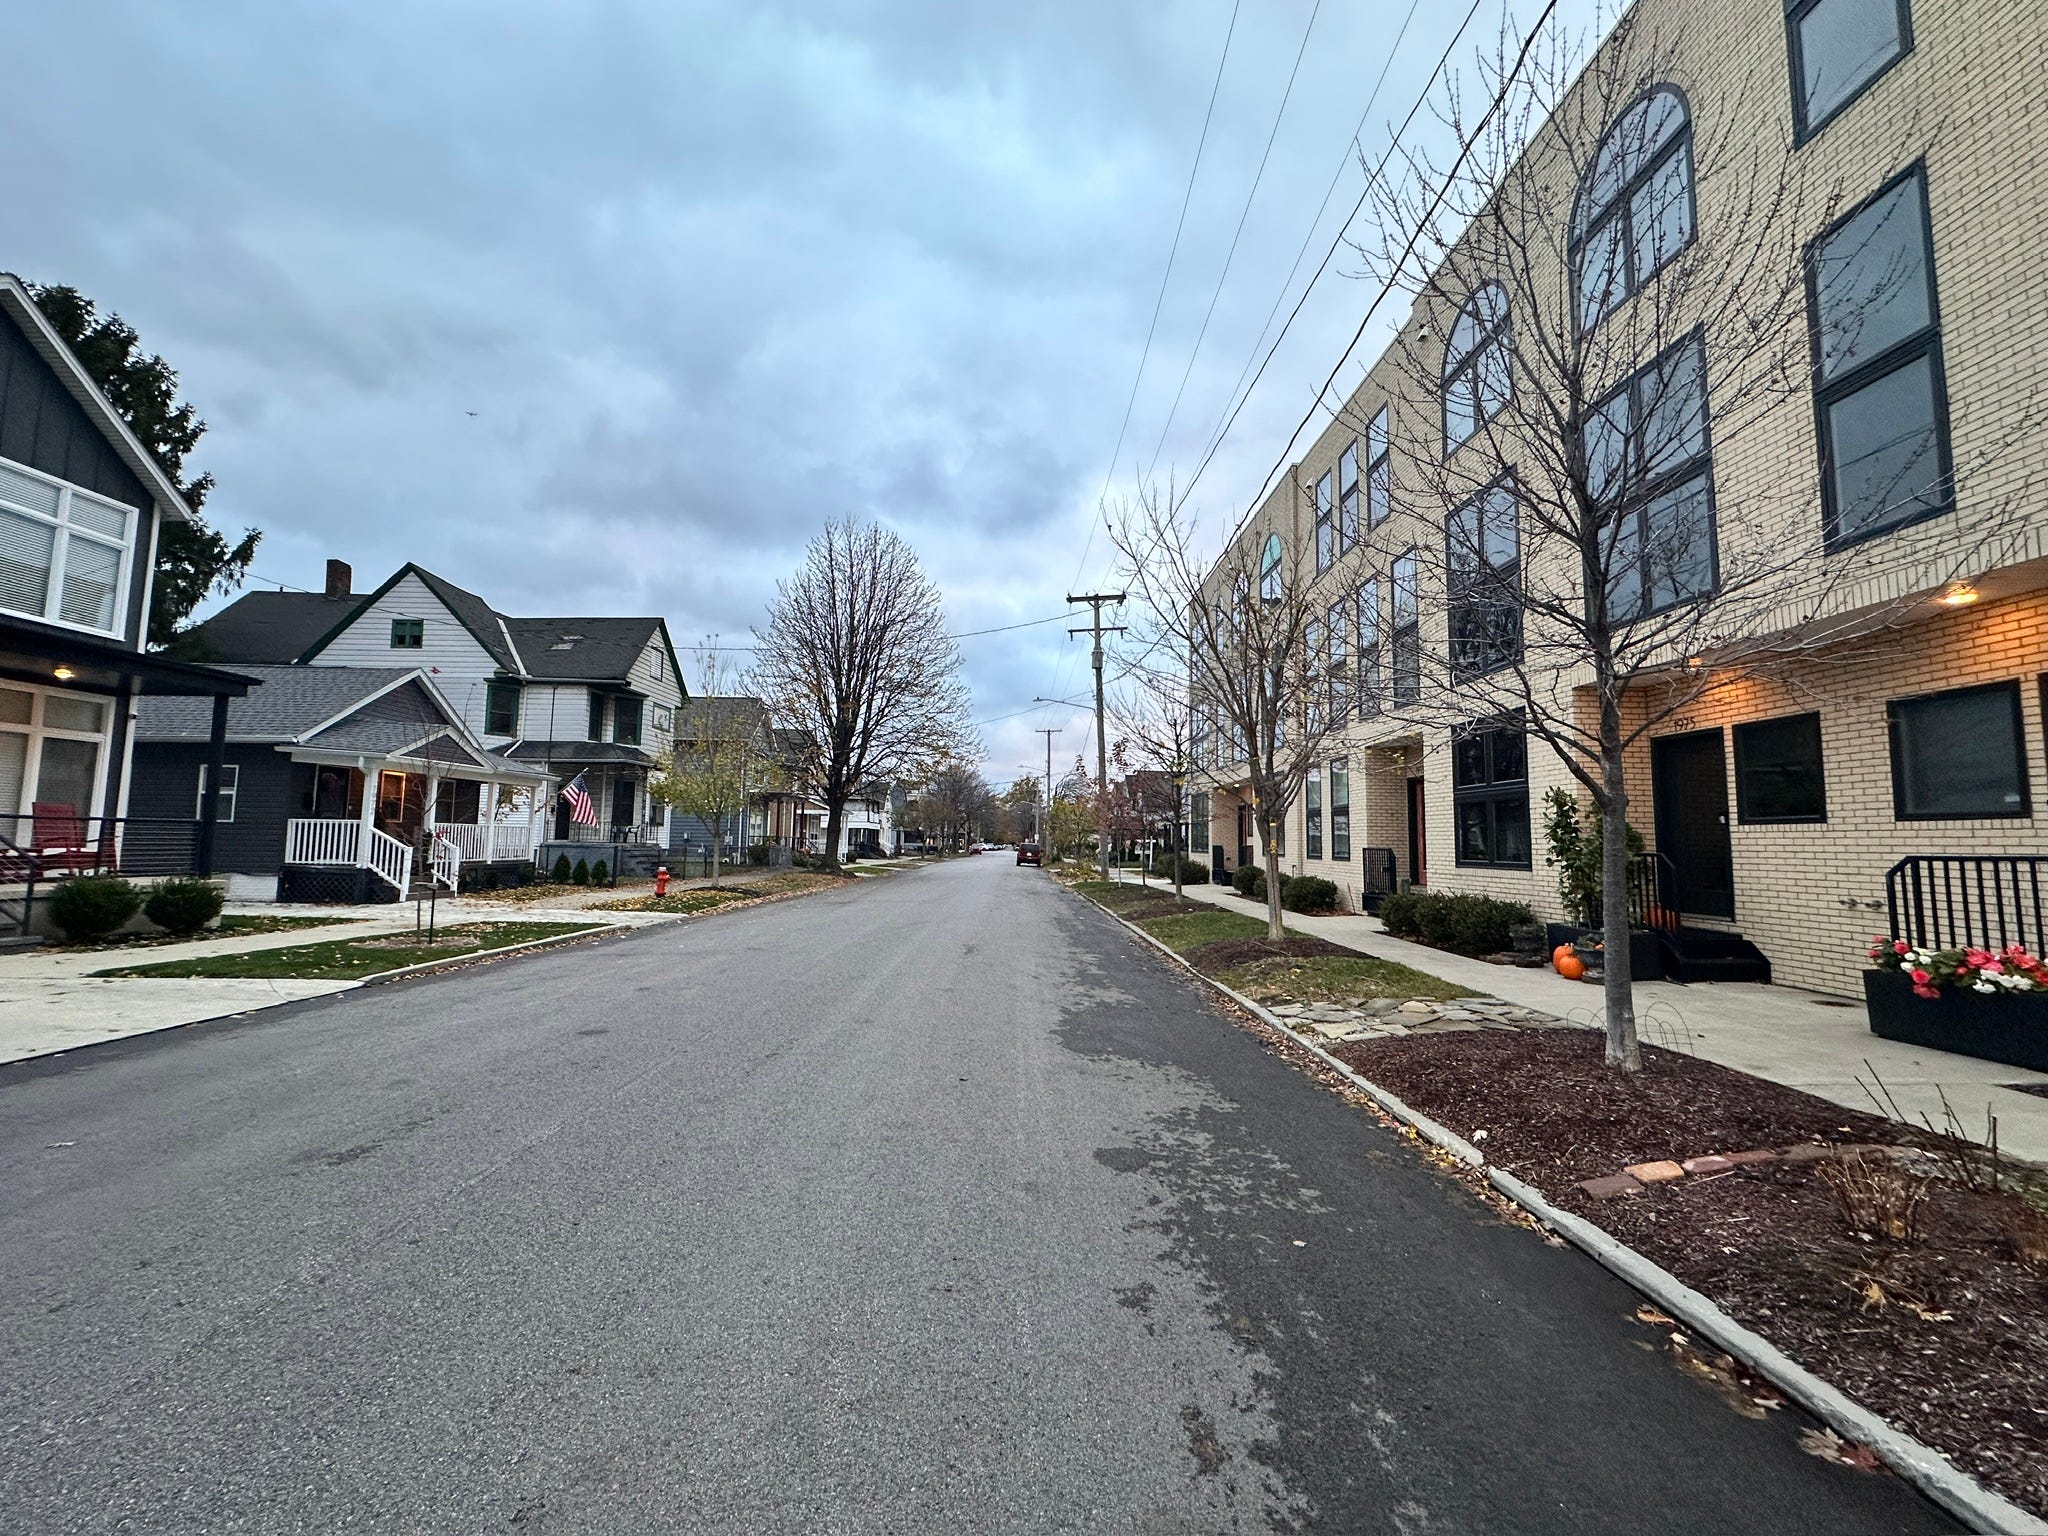
The older stock shows where the second unit earns its keep. In the Opportunity blocks, two-to-four-family buildings outsold single-family homes, 68 to 59. The median duplex closed at $150,750, well above the $95,000 single-family median. Listings there commonly cite unit rents of around $1,000 to $1,650 a month. Where owner-occupant demand alone is thin, rental income adds value. In Ohio City, Tremont, and Detroit Shoreway the order flips. The median duplex sold for $250,000, below the $372,000 single-family median, and what has been built new is the townhome.
That makes new two-family construction a valuation question as much as a design one. A new duplex on a Market Rate lot will be appraised against century-old duplexes on one side and new townhomes on the other, and neither is a close comparable. In the Opportunity blocks, the rent that already supports the older duplexes is the strongest argument for the format the City wants. For owners of existing rental and HUD-assisted properties nearby, these buildings will also start to appear in the competitive set, which makes the choice of comparables more consequential at renewal.
The Line on the Map
The Neighborhood Development Index is an administrative tool. The boundary between a $10 lot and a 70-cent lot is a line drawn to set policy, not a fact about the soil. The Market Rate blocks on this list did not start on that side of it, and Detroit Shoreway already straddles it.
With this RFP, the City has invited the market to price that line directly. The sealed bids will be the clearest reading yet of where the near west side’s land market sits, and of how much of its strength the City can carry into the neighborhoods still waiting their turn.
Methodology: MLS-NOW closings of single-family homes, condominiums, and two-to-four-family buildings from mid-May to mid-November 2026. Land data covers MLS land listings and closings over the prior 12 months. Parcel data comes from the City of Cleveland’s RFP 2026-GEN-1 parcel list.
Eve Moss is the founder of Clarendon and editor of MarketRent™.
More on Cleveland


The FY2027 data is live on marketrent.us - the SAFMR heat map covers every ZIP code by bedroom count, with the change from last year. The calculator does the same for a single ZIP and marks the 150 percent threshold, using FY2027 for anything renewing on or after October 1. Both are free with a MarketRent™ account, along with the market briefs and Ask MarketRent, which answers questions against everything published here.


Archive • About • Tools • Services • Contact
About Clarendon: Clarendon is a commercial real estate advisory firm specializing in affordable and multifamily housing — providing brokerage, valuation, HUD Rent Comparability Studies, market studies, and appraisals for owners, investors, housing authorities and agencies nationwide.
© 2026 The Clarendon Group, Inc. All Rights Reserved. Disclosure