


National summary
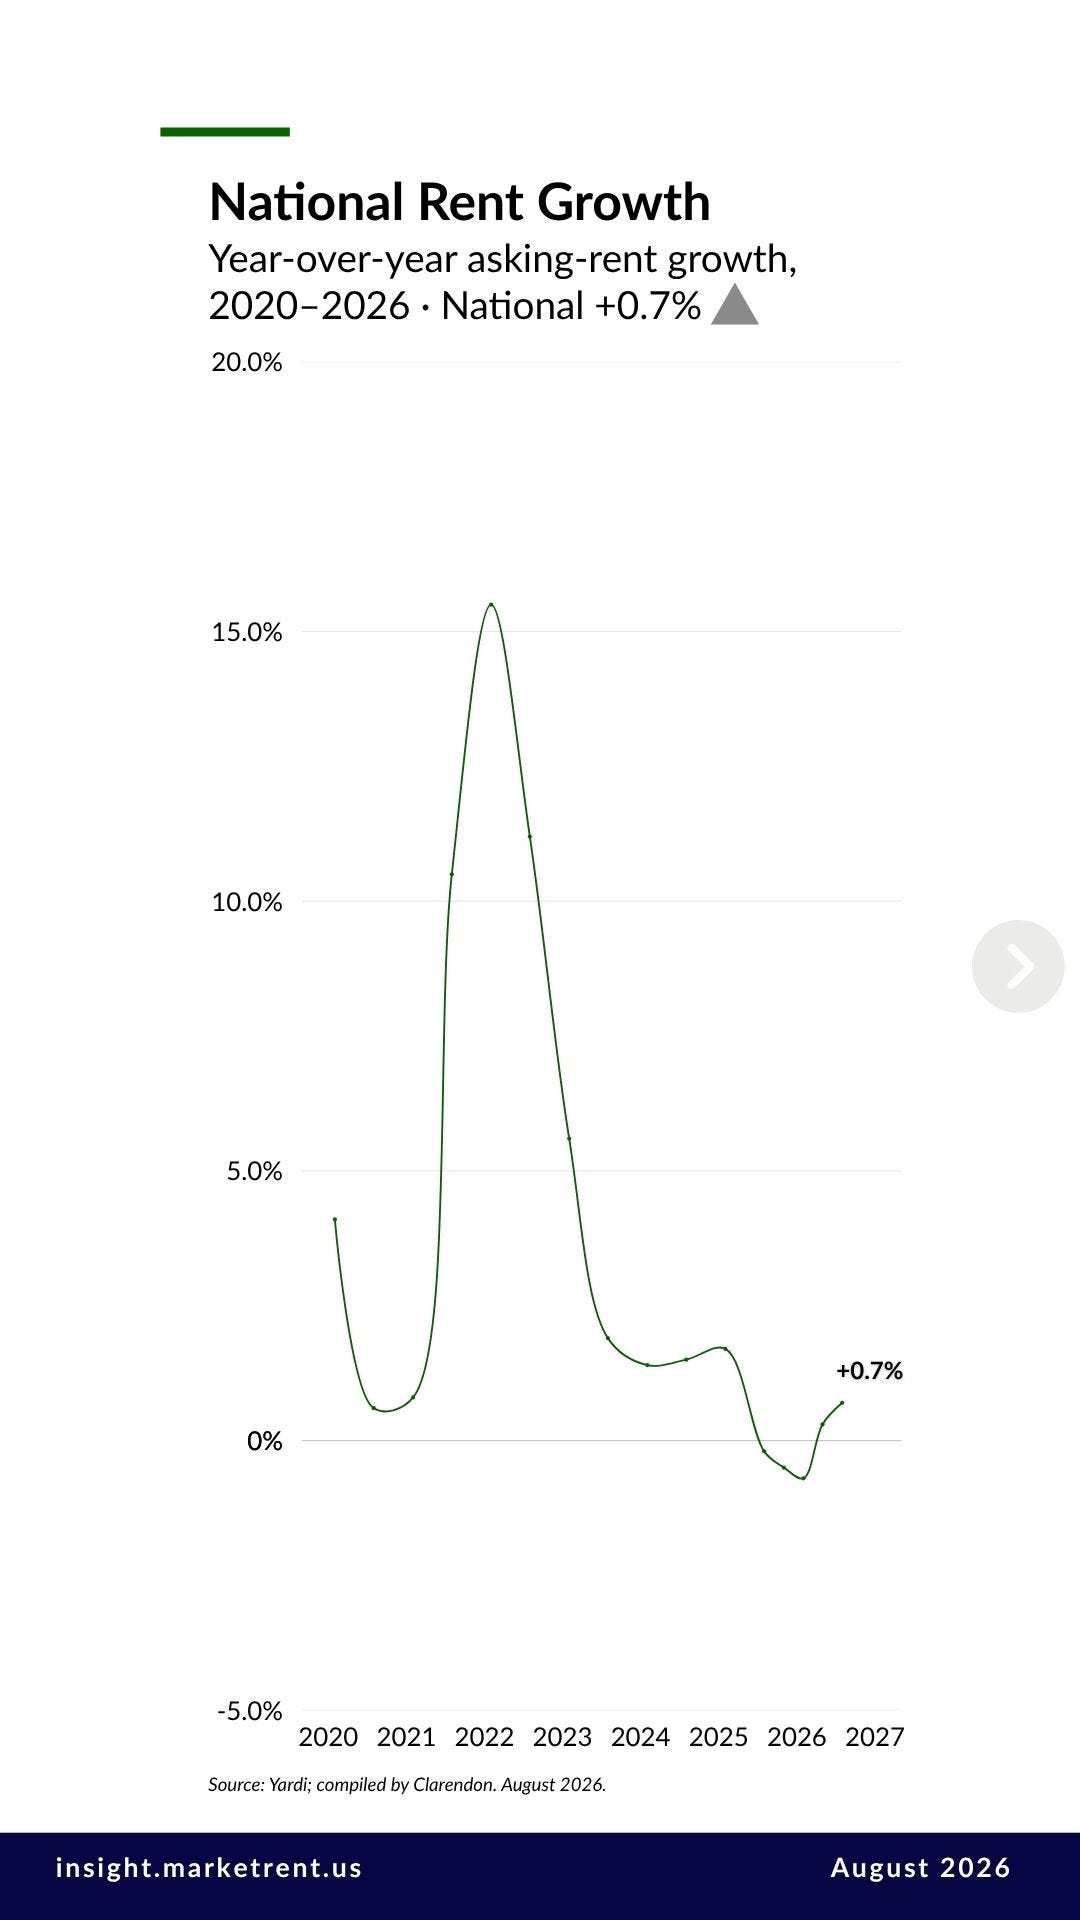
The national average asking rent reached $1,811 in August, up 0.7 percent from a year earlier and 0.1 percent from July. That is the fifth consecutive month of annual growth after a year in which national rents ran below their prior-year level. It is also the strongest annual gain since March 2025. The number is still modest by any historical standard, but the direction has been consistent since April.
Occupancy moved the other way. National occupancy was 94.3 percent, down 33 basis points from a year earlier and essentially unchanged from July, so rents are firming while buildings are slightly less full. That combination usually means pricing is recovering faster than new supply is being absorbed. How long it lasts depends on where the remaining supply lands, which is what the regional data shows.
Rent growth by region
The Midwest led again at 2.5 percent, the only region above 2 percent, as it has been all year. The West followed at 1.1 percent, the Southeast at 0.8, and the Northeast at 0.5. The Southwest remained the only region below its prior-year level, at −0.2 percent.
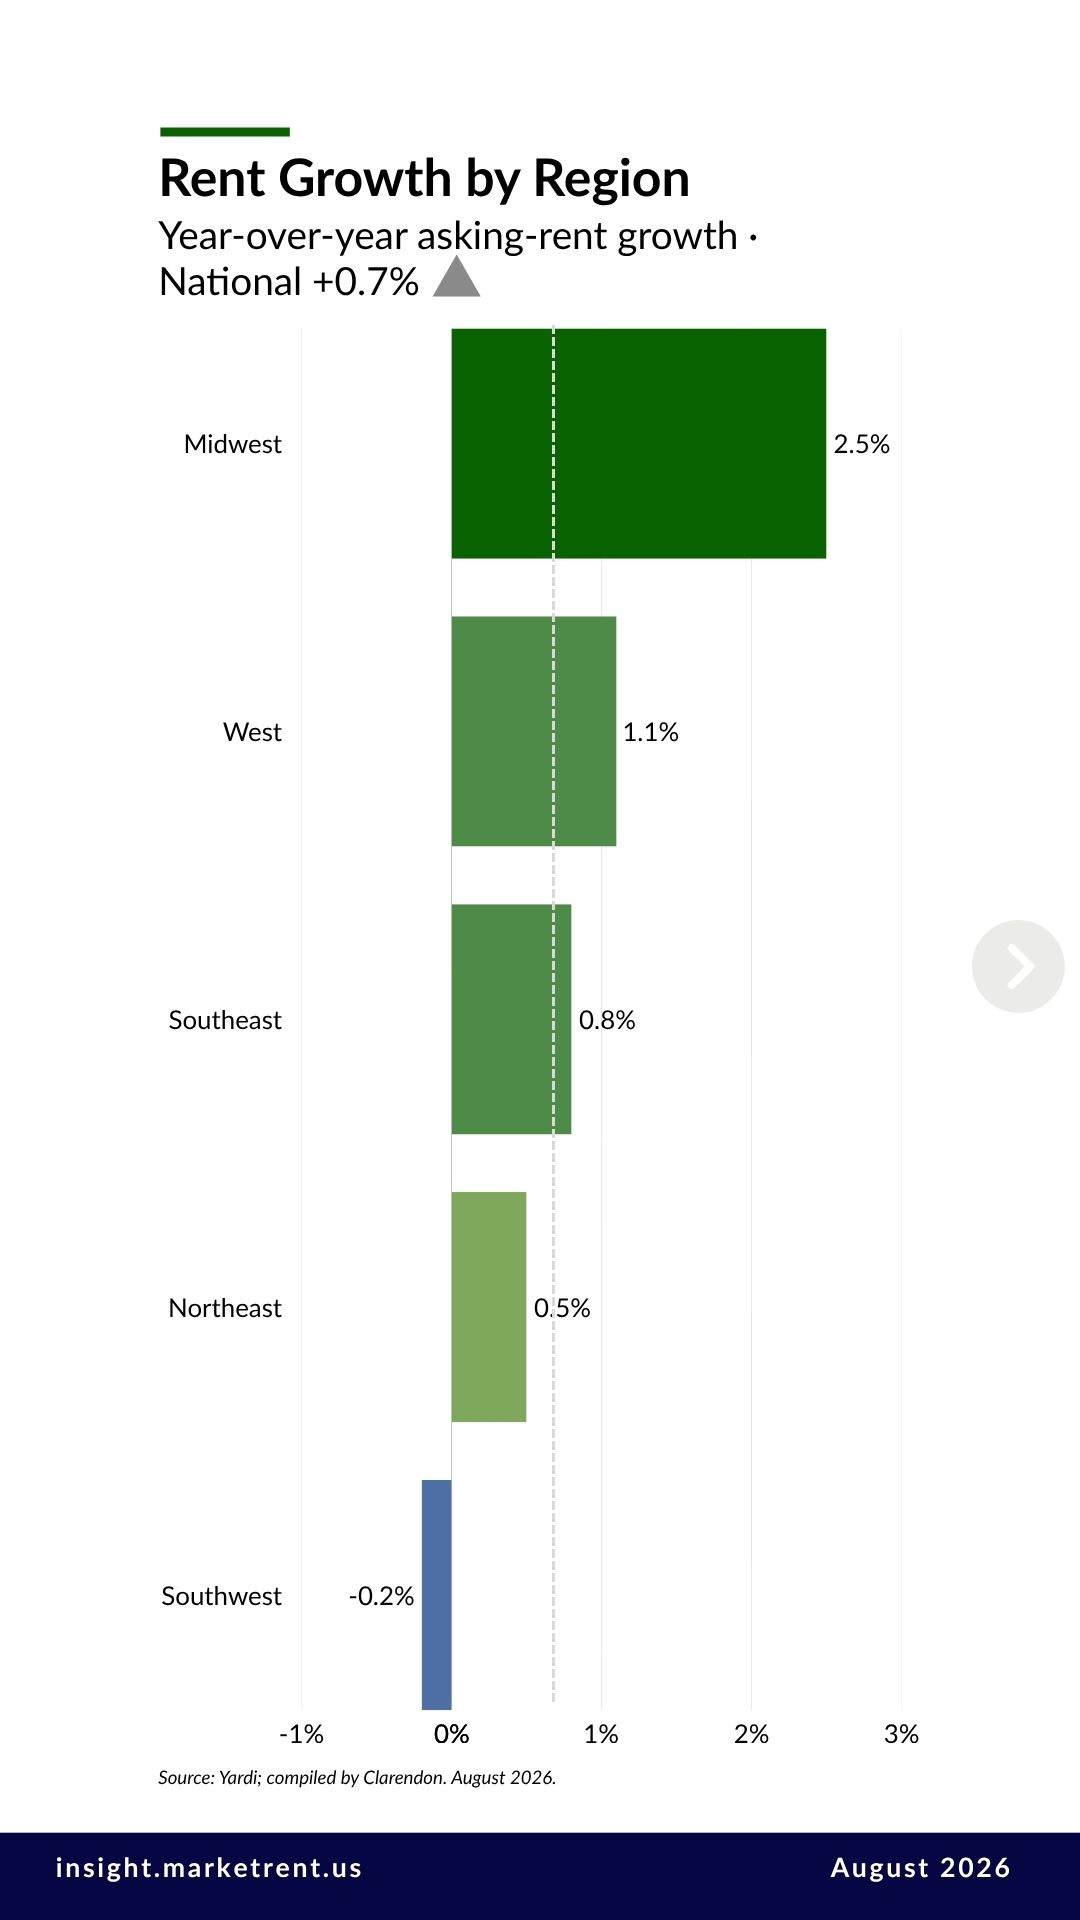
The shift since July is that the other four regions are closing the gap. Each improved on its July reading, and the Southwest’s decline narrowed by about half. The Midwest eased slightly from July and was the only region to slip month over month. The spread between the strongest and weakest region narrowed from roughly three points to 2.7. The Midwest is still ahead. It is simply less alone.
At the market level, the largest gains among markets with at least 50,000 surveyed units came from the Bay Area, San Francisco–Peninsula (9.2 percent) and South Bay (6.7). The softest were Sun Belt markets still working through recent deliveries: Southwest Florida Coast (−2.9), San Antonio (−2.7) and Austin (−1.6).
Rent growth by class
Nationally, the most affordable class is leading. Workforce-Lower rents grew 1.5 percent over the year, up from 1.3 in July and more than twice the pace of any other class. The remaining four sit close together: Upper Mid-Range and Workforce-Upper each at 0.6 percent, Discretionary at 0.4, and Low Mid-Range at 0.2.
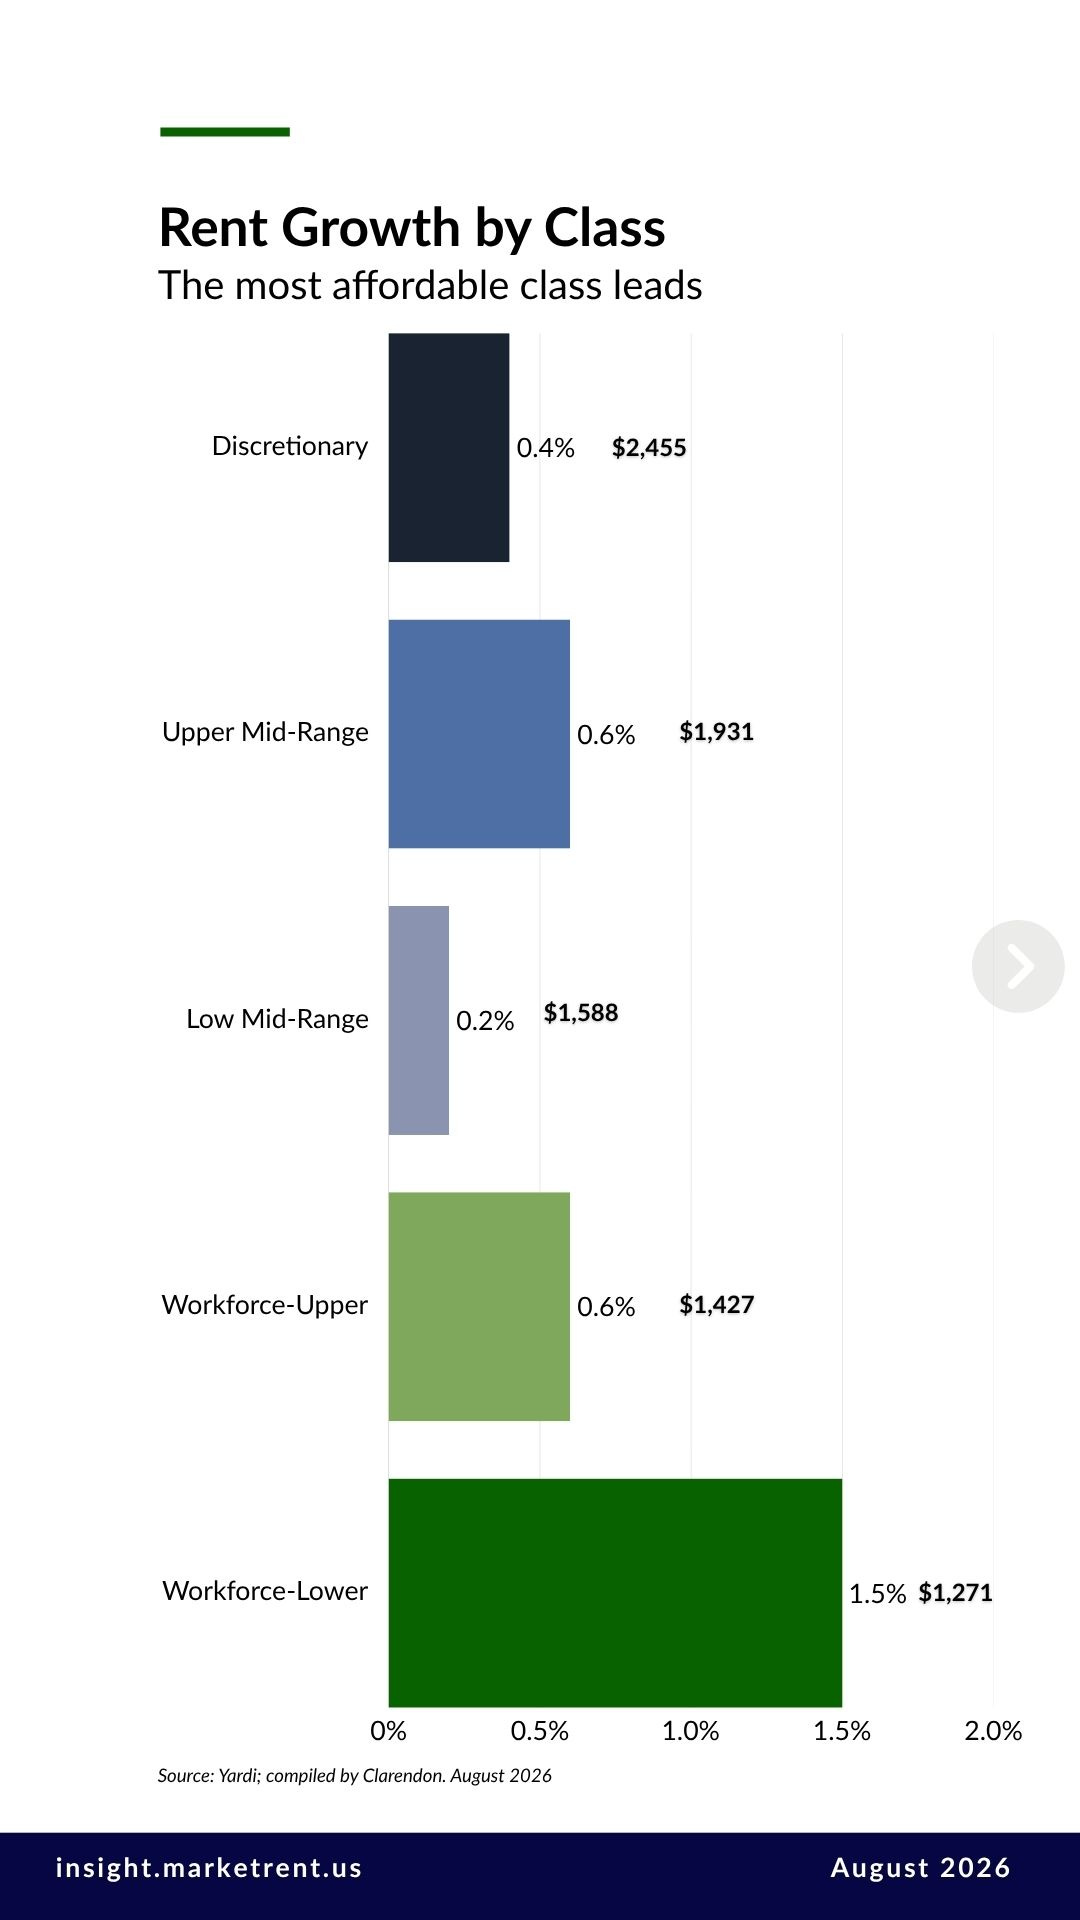
At the national scale, the gap between the top and bottom of the market is narrower than it looks in individual metros. Where it widens, local supply is usually the reason. Next week’s MarketRent™ report looks at one metro where the gap is far wider: Cleveland–Akron.
Occupancy
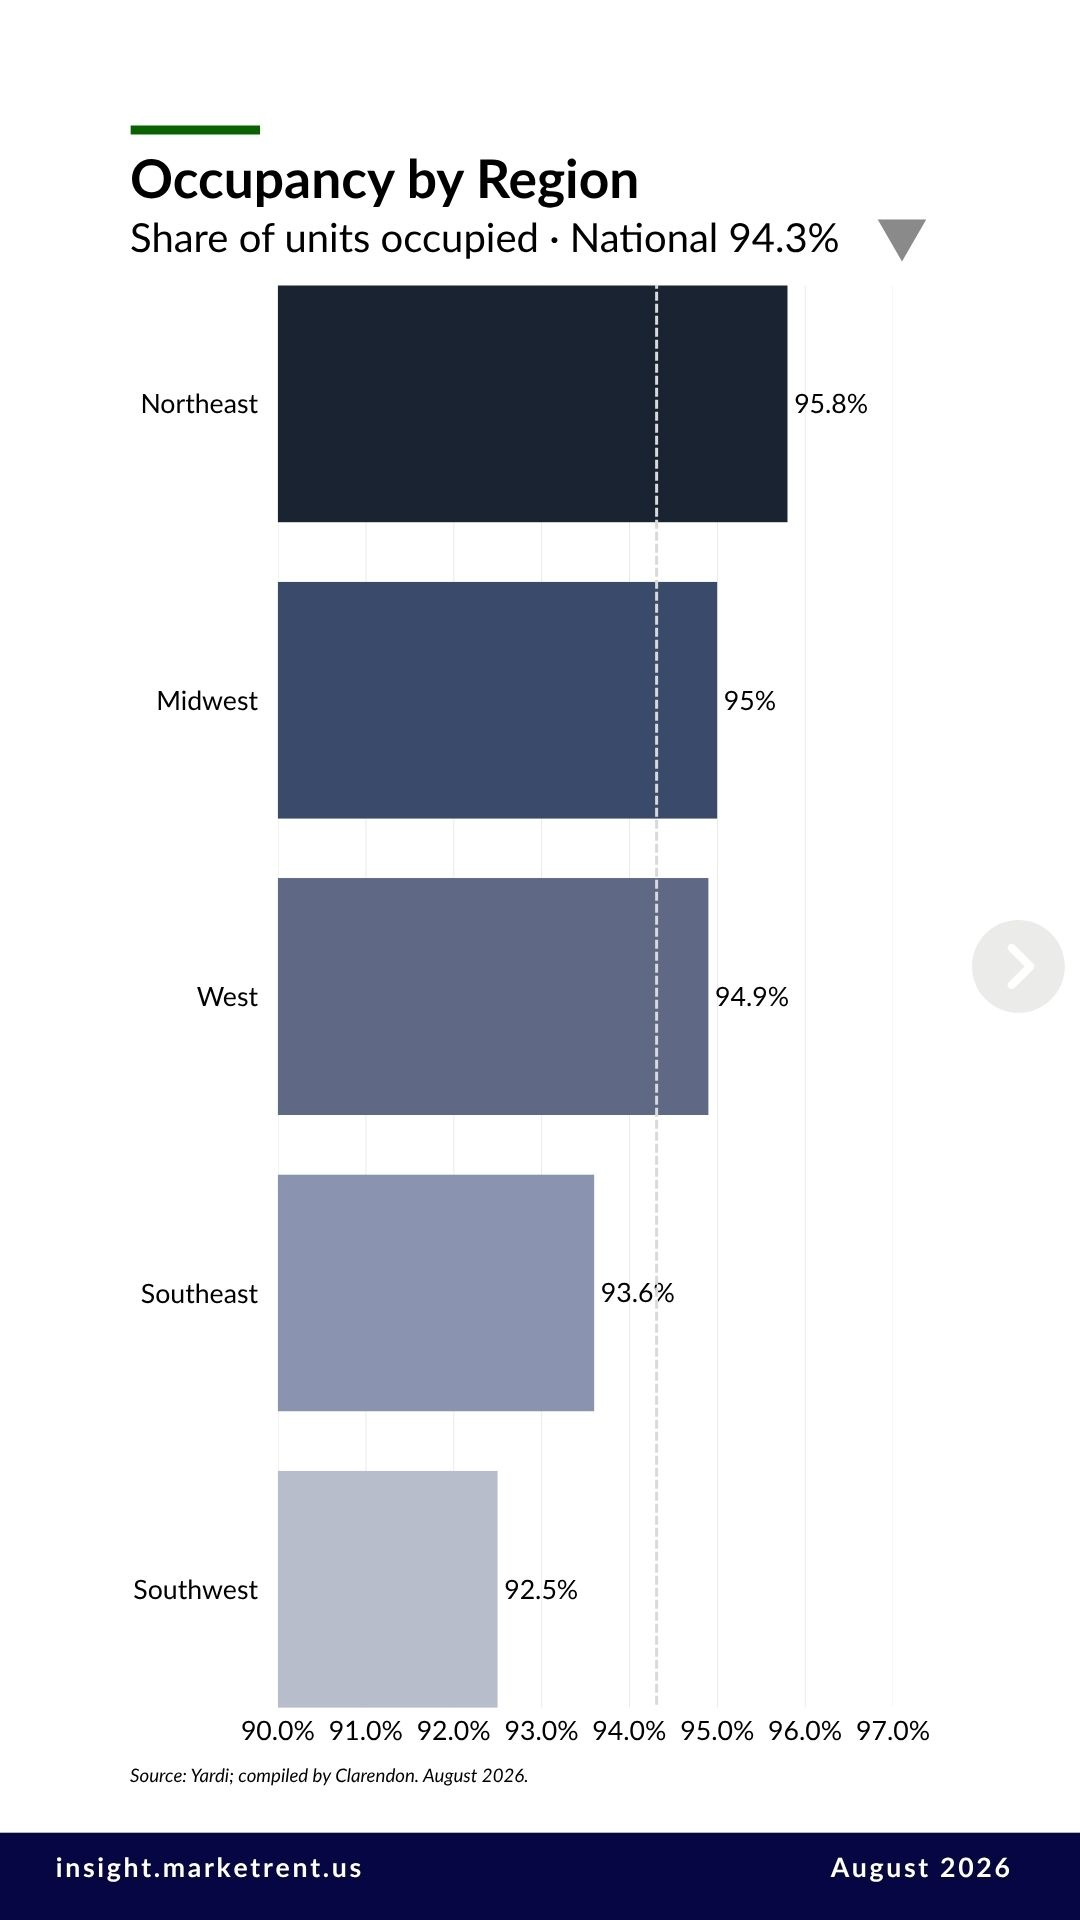
Occupancy by region follows the familiar order. The Northeast is tightest at 95.8 percent, followed by the Midwest at 95.0, the West at 94.9, the Southeast at 93.6, and the Southwest at 92.5. Every region is modestly below its level of a year ago, by between 17 and 47 basis points. The Southwest, which absorbed the most new supply over the past two years, shows the largest decline.
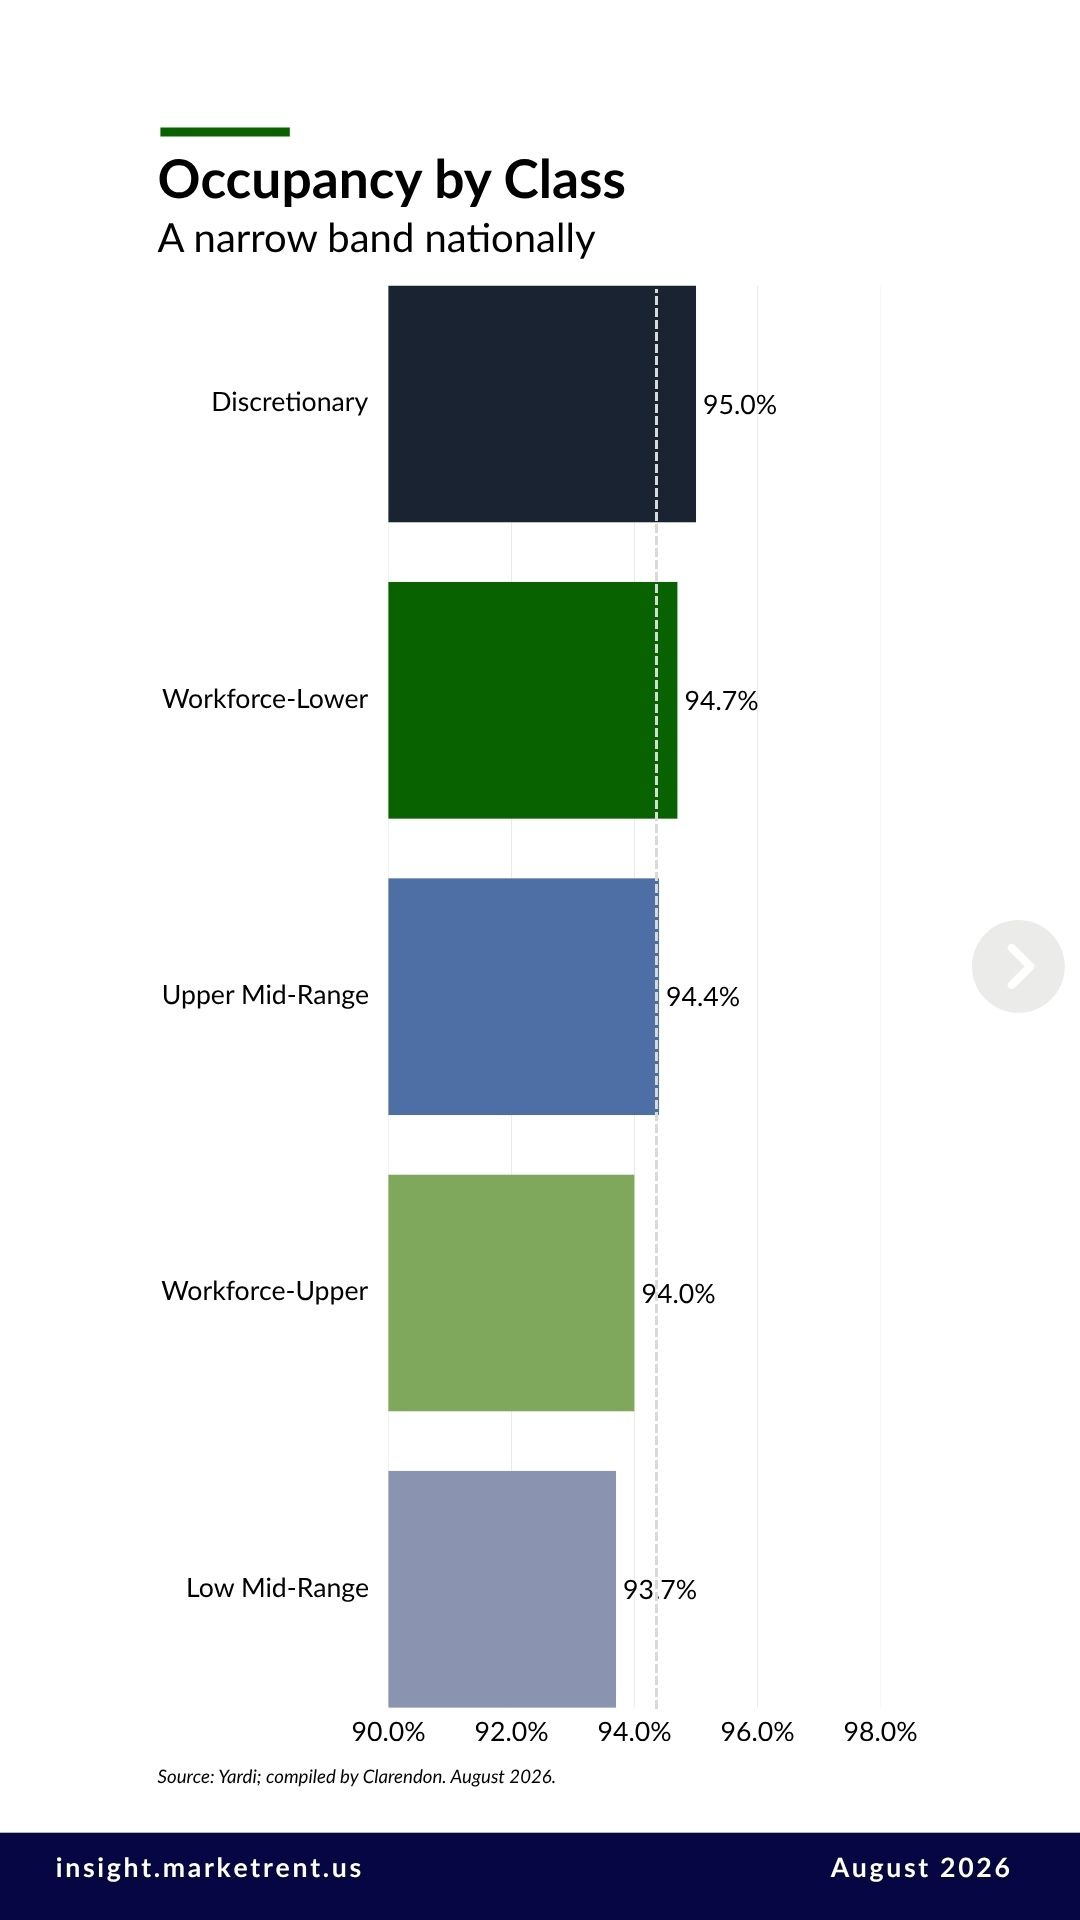
By class, the national pattern is worth noting for owners of affordable and workforce properties. Discretionary properties were the fullest at 95.0 percent and nearly unchanged from a year earlier. The Low Mid-Range and both Workforce classes, at 93.7 to 94.7 percent, gave up 45 to 56 basis points. Nationally, lower rents are not translating into a larger occupancy cushion this year. That makes each property’s position relative to its local market more important, not less.
Supply
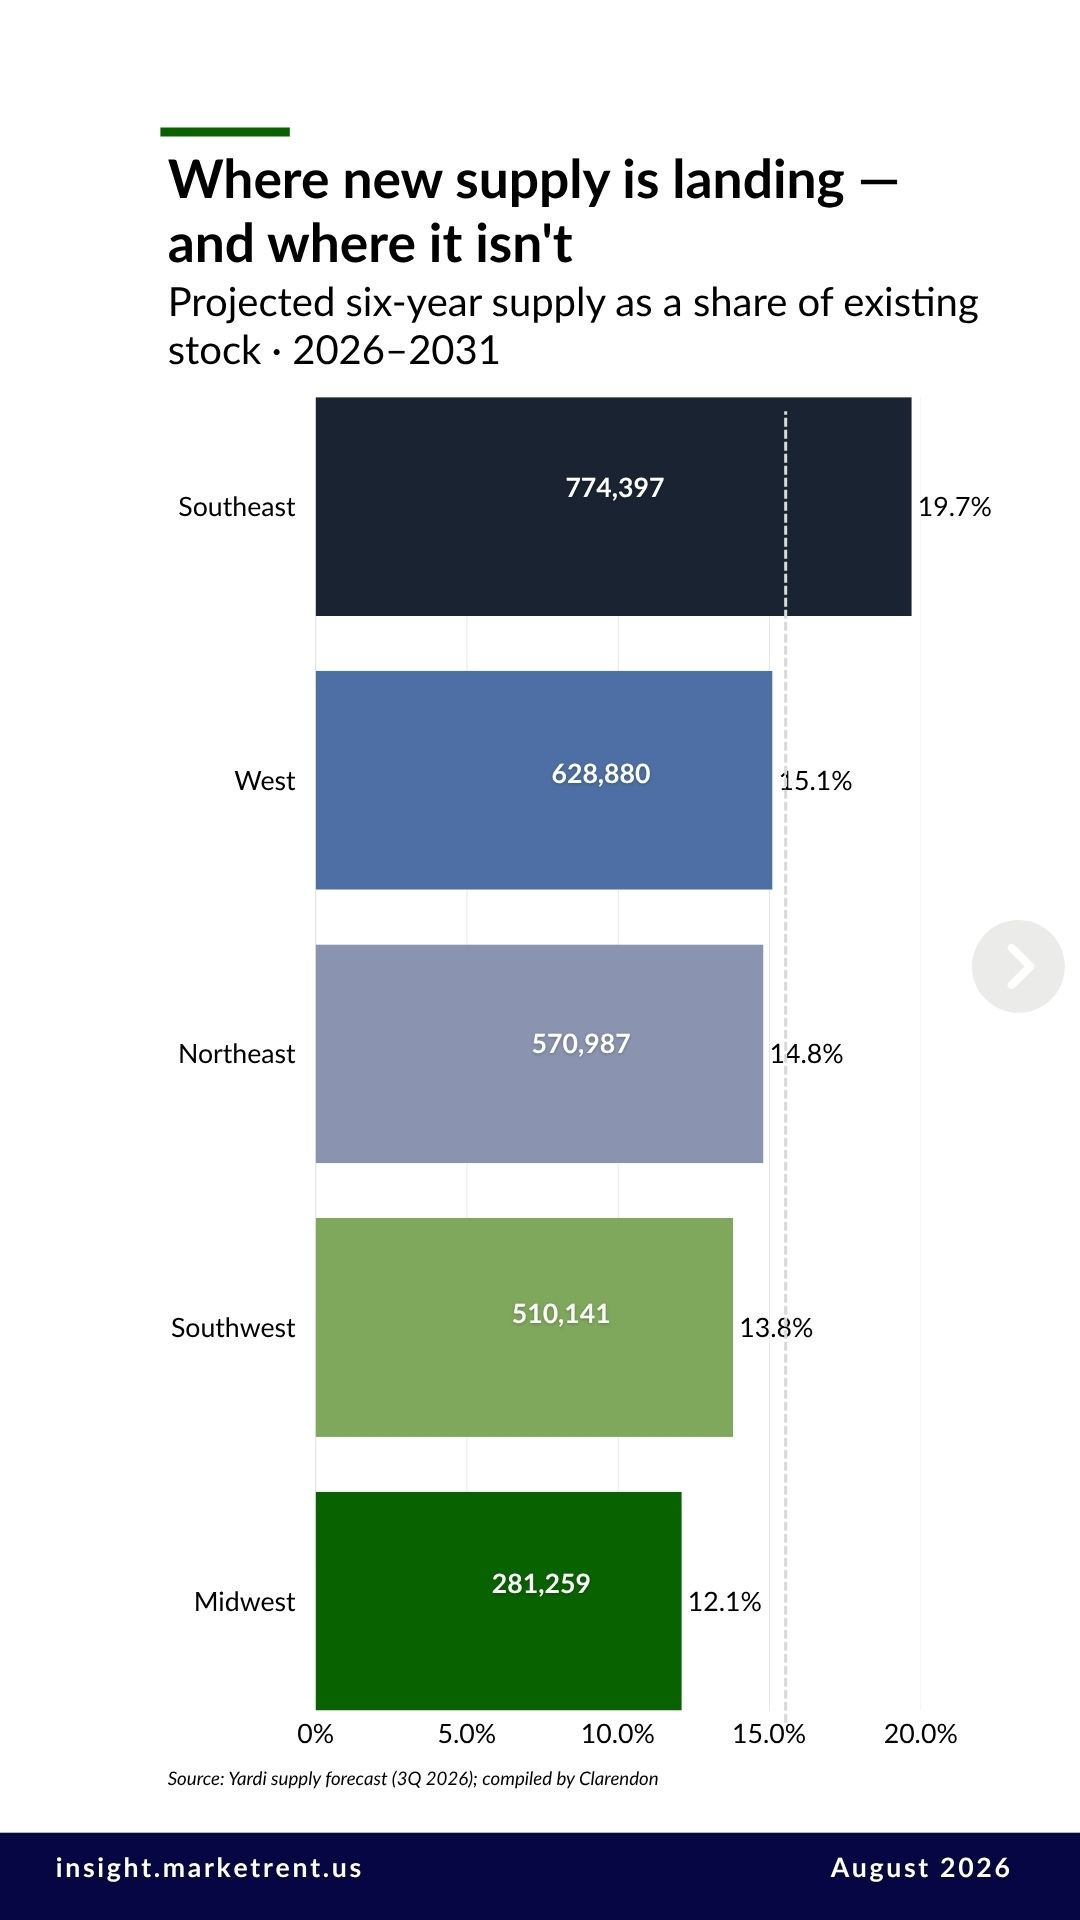
Yardi’s updated completions forecast keeps the supply map where it was. Over 2026–2031, the Southeast is projected to add about 774,000 units, equal to 19.7 percent of its existing stock. The West follows at 629,000 (15.1 percent), the Northeast at 571,000 (14.8), and the Southwest at 510,000 (13.8). The Midwest is projected to add 281,000 units, or 12.1 percent of its stock. That is the least of any region by both count and share, and well under half the Southeast’s volume. The national figure is 15.4 percent.
The affordable pipeline follows the same order. Through 2028, the Midwest is projected to add about 23,000 affordable units, against 82,000 in the West and 48,000 in the Southeast.
What it means
The regions are converging. That is what a supply cycle looks like as it passes its peak: markets that absorbed the 2024 delivery wave are recovering, and the market that never built one is holding steady rather than accelerating. The Midwest’s lead no longer comes from outrunning the rest of the country. It comes from never having had to recover. Over a longer hold, that difference between a market that is recovering and one that simply held tends to matter more than any single month’s ranking.
Pulse — What We’re Tracking
FY2027 Fair Market Rents take effect October 1. HUD’s new FMRs and Small Area FMRs govern voucher payment standards starting next week. Nationally the Small Area benchmark rose 1.7 percent, our SAFMR analysis covers why the benchmark trails the market by roughly two years. Two owners can read the same release and be in opposite positions: one whose contract has drifted above what the market supports, one whose benchmark stalled while the market kept moving. The federal data won’t say which is which.

The FY2027 data is live on marketrent.us . The SAFMR heat map covers every ZIP code by bedroom count, with the change from last year. The calculator does the same for a single ZIP and marks the 150 percent threshold: FY2027 for anything renewing on or after October 1, FY2026 until then. Both are free with a MarketRent™ account, along with the market briefs and Ask MarketRent, which answers questions against everything published here.

For questions on this report, contact Eve Moss, founder of Clarendon and editor of MarketRent™. Next week: Cleveland–Akron, class by class.
Data: Yardi Matrix, asking-rent basis; data through August 2026, subject to revision as additional properties report. National and regional figures are unit-weighted across 189 Yardi markets and compiled by Clarendon; this weighting is why the national average differs from Yardi’s published national figure. Regional groupings follow the five-region structure used by HUD’s Office of Multifamily Housing (Northeast, Southeast, Midwest, Southwest, West); markets are assigned by primary state. Supply: Yardi Matrix completions forecast (3Q 2026), 2026–2031; affordable figures cover 2026–2028.

Archive • About • Tools • Services •Contact
About Clarendon: Clarendon is a commercial real estate advisory firm specializing in affordable and multifamily housing — providing brokerage, valuation, HUD Rent Comparability Studies, market studies, and appraisals for owners, investors, housing authorities and agencies nationwide.
© 2026 The Clarendon Group, Inc. All Rights Reserved. Disclosure