

Section 8 Property Values: What They Actually Sell For
An active national market, a pricing range that runs from the teens to the six figures, and what determines where an asset lands. Data covers 50+ unit properties.

There is a number that gets repeated about affordable housing sales — a national average price per unit, the kind of figure that anchors a headline and settles nothing. It describes a market that doesn’t exist: a single “typical” Section 8 property trading at a single typical price.
The transaction record describes something else entirely. Project-Based Section 8 assets have changed hands at prices ranging from under $20,000 per unit to well over $200,000 — sometimes in the same region, sometimes in the same year. The average is the midpoint of forces pulling hard in opposite directions, and it tells an owner almost nothing about what their specific property is worth.
What the record does show clearly is that the market is active, deep, and competitive. That part is not ambiguous.
An Active Market
The volume isn’t marginal — it’s a deep, liquid market for subsidized cash flow.
Over the past five years, more than $5.7 billion in Project-Based Section 8 properties have traded across the country — over 400 transactions spanning every region, representing nearly 47,000 assisted units. Nearly a quarter of that activity has come in just the last two years. (Source: Yardi Matrix; conventional arm’s-length sales of 50+ unit properties, 2020–2025.)
The throughline is demand for stability. Overall multifamily transaction volume ran roughly 11% below the prior year through May 2026, held back by a shortage of willing sellers, per Yardi Matrix — yet Section 8 assets kept trading. Investors compete for project-based subsidy because it offers something conventional multifamily can’t promise in an uncertain rate environment: a contractual, government-backed income stream. And the income has held: net operating income across the affordable segment stayed positive through 2026 even as operating costs rose, per Yardi Matrix. Stable cash flow in a choppy market is precisely what has kept deal flow steady here while other property types stalled.
Median Section 8 Sale Price per Unit, by Year
Median sale price per unit has drifted upward across the period, though the national median is sensitive to which regions transacted in a given year.
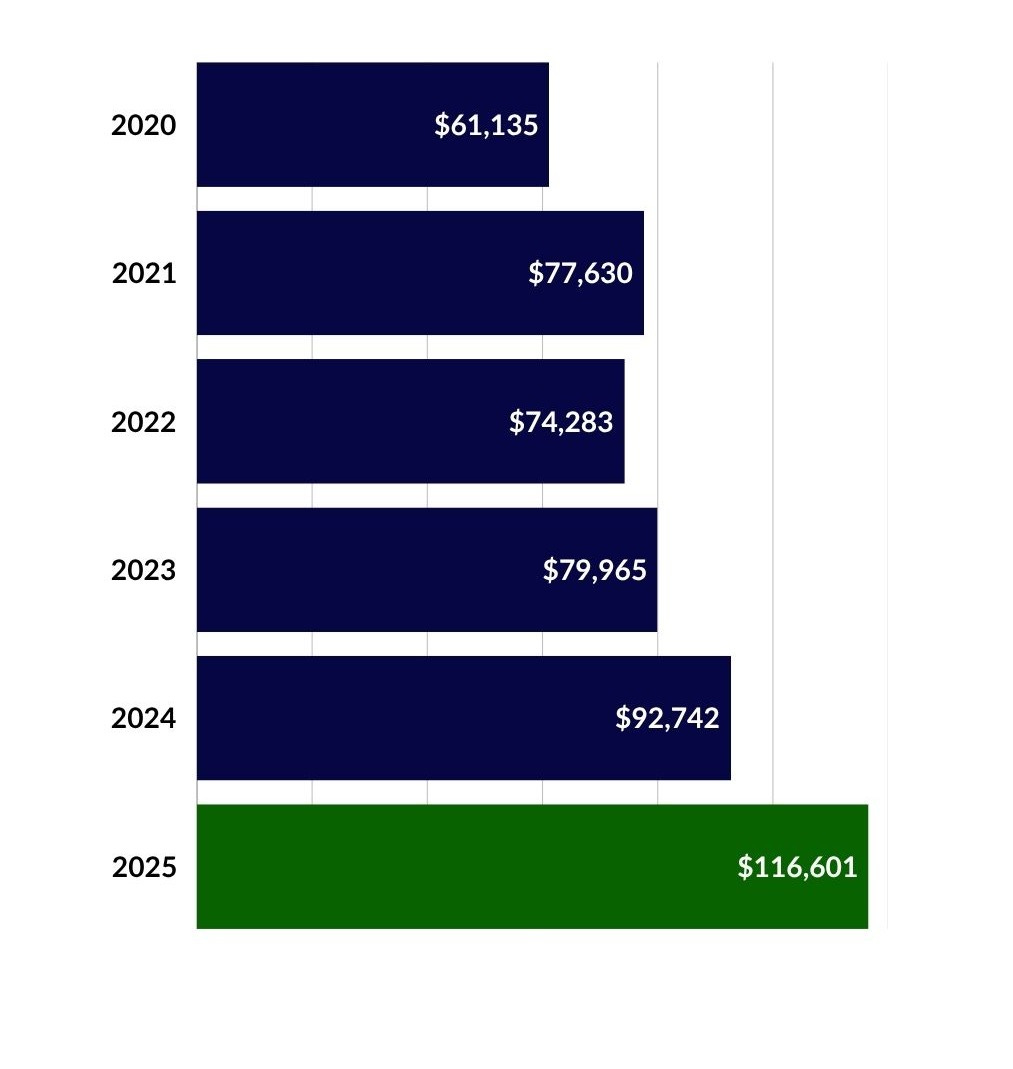
Source: Yardi Matrix
The Range Is the Story
A national median is the midpoint of markets — and assets — that have almost nothing in common.
Pull the transactions apart and the average dissolves. The strongest regional markets — the West, the coastal Northeast — clear at multiples of the Midwest and the South. Within any single market, the spread widens again: a tired, deferred-maintenance asset and a repositioned one a few miles apart can trade at prices that don’t look like they belong to the same property type.
Median Section 8 Sale Price per Unit, by Region (2020–2025)
Region sets the order of magnitude — but not the final number. Within every region, condition and rents move individual sales far beyond the median shown
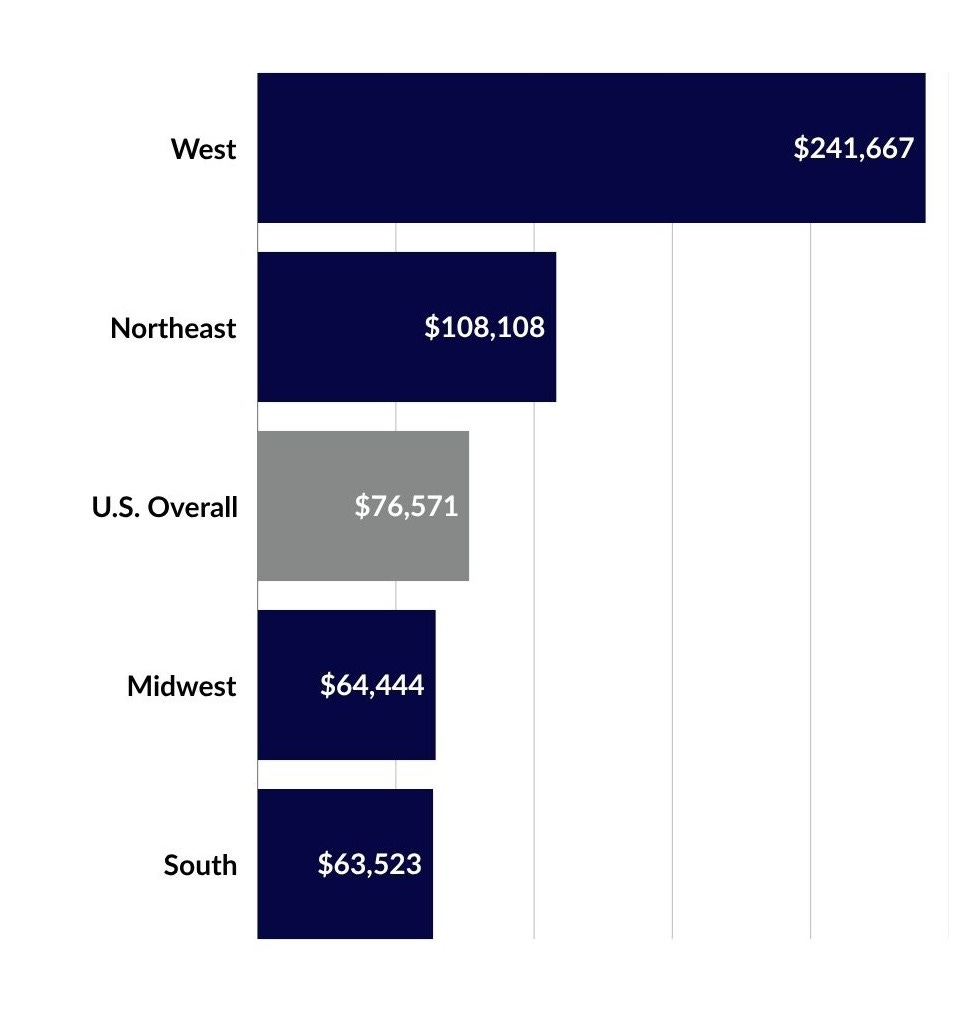
Source: Yardi Matrix.
Region sets the order of magnitude. Three things set where a property lands within it:
Location. Not the metro — the submarket. The same forces that move rents move value, and those forces are intensely local. An asset in a submarket where investment is flowing carries a different value trajectory than one a mile away that the capital has passed by.
Condition. Improvement and capital condition separate assets that look identical on paper. A property carrying years of deferred maintenance and one that’s been recapitalized and repositioned can sit at opposite ends of the range — and the gap between them is precisely the value a buyer expects to create.
Rents. The relationship between in-place rents and what the market supports is the engine of value-add pricing. Where current rents sit well below achievable rents, a buyer underwrites the difference — and pays the seller for upside the seller was never going to chase.
One more caveat worth naming: the published comps skew toward larger assets. Yardi tracks transactions of 50-or-more-unit properties, so smaller assets — a meaningful share of the Section 8 universe — trade on terms the headline numbers never capture. Another reason the average describes no one in particular.
Why the Floor Is Firm
Supply is tightening at both ends — and that supports values for what already exists.
Two forces are quietly working in owners’ favor. First, the affordable construction pipeline is slowing: fully affordable deliveries peaked at roughly 99,600 units in 2024, eased to about 91,800 in 2025, and are forecast to fall further over the next two years as starts decline — down nearly 20% year-over-year entering 2026, per Yardi Matrix. Less new product is coming.
Second, the existing restricted stock is aging out of its protections. More than 1.1 million Low-Income Housing Tax Credit units are projected to reach the end of their compliance periods over roughly the next fifteen years, with another 515,000 units facing expiring extended-use restrictions, according to Yardi Matrix. That wave creates an enormous preservation need — and a steady pipeline of assets changing hands as owners reach decision points on aging properties.
Constrained new supply, an aging restricted inventory, and stable income are a combination that supports pricing for well-positioned assets that already exist. It’s a meaningful part of why investors keep competing for them.
Ohio sits squarely in the Midwest band, with the same wide within-market spread that defines the national picture. Within Cleveland alone, submarket rent trajectories range from +11% to −1.3% — a twelve-point spread behind a single metro average. That submarket divergence is what sets one property’s value apart from another’s, even a few miles away. We covered the Cleveland case in detail here.
What the Average Can’t Tell You
The one number that matters isn’t in any market report.
For an owner, the national median is the wrong tool for the only decision that matters. It can’t tell you whether your submarket is a tailwind or a headwind. It can’t price the condition of your asset, the gap between your rents and the market’s, or the way your HAP contract and REAC history bear on what a buyer will pay. Those are the variables that move a Section 8 transaction by tens of thousands of dollars per unit — and none of them appear in an average.
What the market data can tell you is that there are buyers, that they are active, and that they are paying real prices for stabilized subsidized assets. The question worth answering is where a specific property sits in a range that runs from the teens to the six figures. That answer doesn’t come from a market report. It comes from a current, property-specific look at the comps, the condition, and the rents.
Pulse — What We’re Tracking
Section 8 deal volume held through the rate cycle — while conventional multifamily transaction activity thinned from 2022 onward, project-based subsidized assets kept trading, a sign of how investors weigh contractual income against rate risk.
The 50+ unit coverage gap — published sales data systematically underrepresents smaller assets, leaving a meaningful part of the Section 8 market priced in the dark.
Regional dispersion is widening — the gap between the highest- and lowest-priced regional medians has grown, not narrowed, as capital concentrates.
If you own a Section 8 or affordable multifamily property, the number that matters isn’t the market average — it’s where your specific asset sits in a very wide range. Clarendon Property Advisors advises owners on affordable and multifamily transactions. Request a confidential asset evaluation →

Tools • Services • Archive • About • Contact
About: Clarendon is a trusted partner for government compliance and advisory solutions, specializing in HUD-compliant services: brokerage, appraisals, rent comparability studies, market studies, inspections, facility support and strategic guidance for agencies, housing authorities and property owners nationwide.
© 2026 The Clarendon Group, Inc. All Rights Reserved. Disclosure