



In August, “One Number, Five Stories” traced a flat national rent number back to five regional stories, and all five came back to one variable. Where developers chased the 2022 rent surge, they built their own correction. Where they didn’t, rent growth held. The sentence that closed that piece was simple: the rent growth is where the supply isn’t.
Last week’s August report didn’t change the plot. Nationally, rents are modestly firmer, and the regions are still sorting by supply. But a national thesis only goes so far for an owner. You don’t own the national average. You own buildings in a submarket, in a class, competing against specific properties for specific renters. So the question worth asking is whether the pattern holds at the scale where decisions get made.
Cleveland–Akron is a good place to test it. The Midwest led every region in August, and Cleveland sits in the middle of it.
A break, not a slope
Nationally, class barely separates the market. In August, Workforce-Lower rents grew 1.5 percent, and every other class landed between 0.2 and 0.6 percent.
Cleveland–Akron draws a much sharper line. Discretionary rents slipped 0.5 percent over the year, and Upper Mid-Range rose 0.9. Below that, the line steps up and stays up: Low Mid-Range grew 3.7 percent, Workforce-Lower 3.4, and Workforce-Upper 3.1. The metro as a whole grew about 3 percent. That headline sits between two groups behaving very differently, and it describes neither.
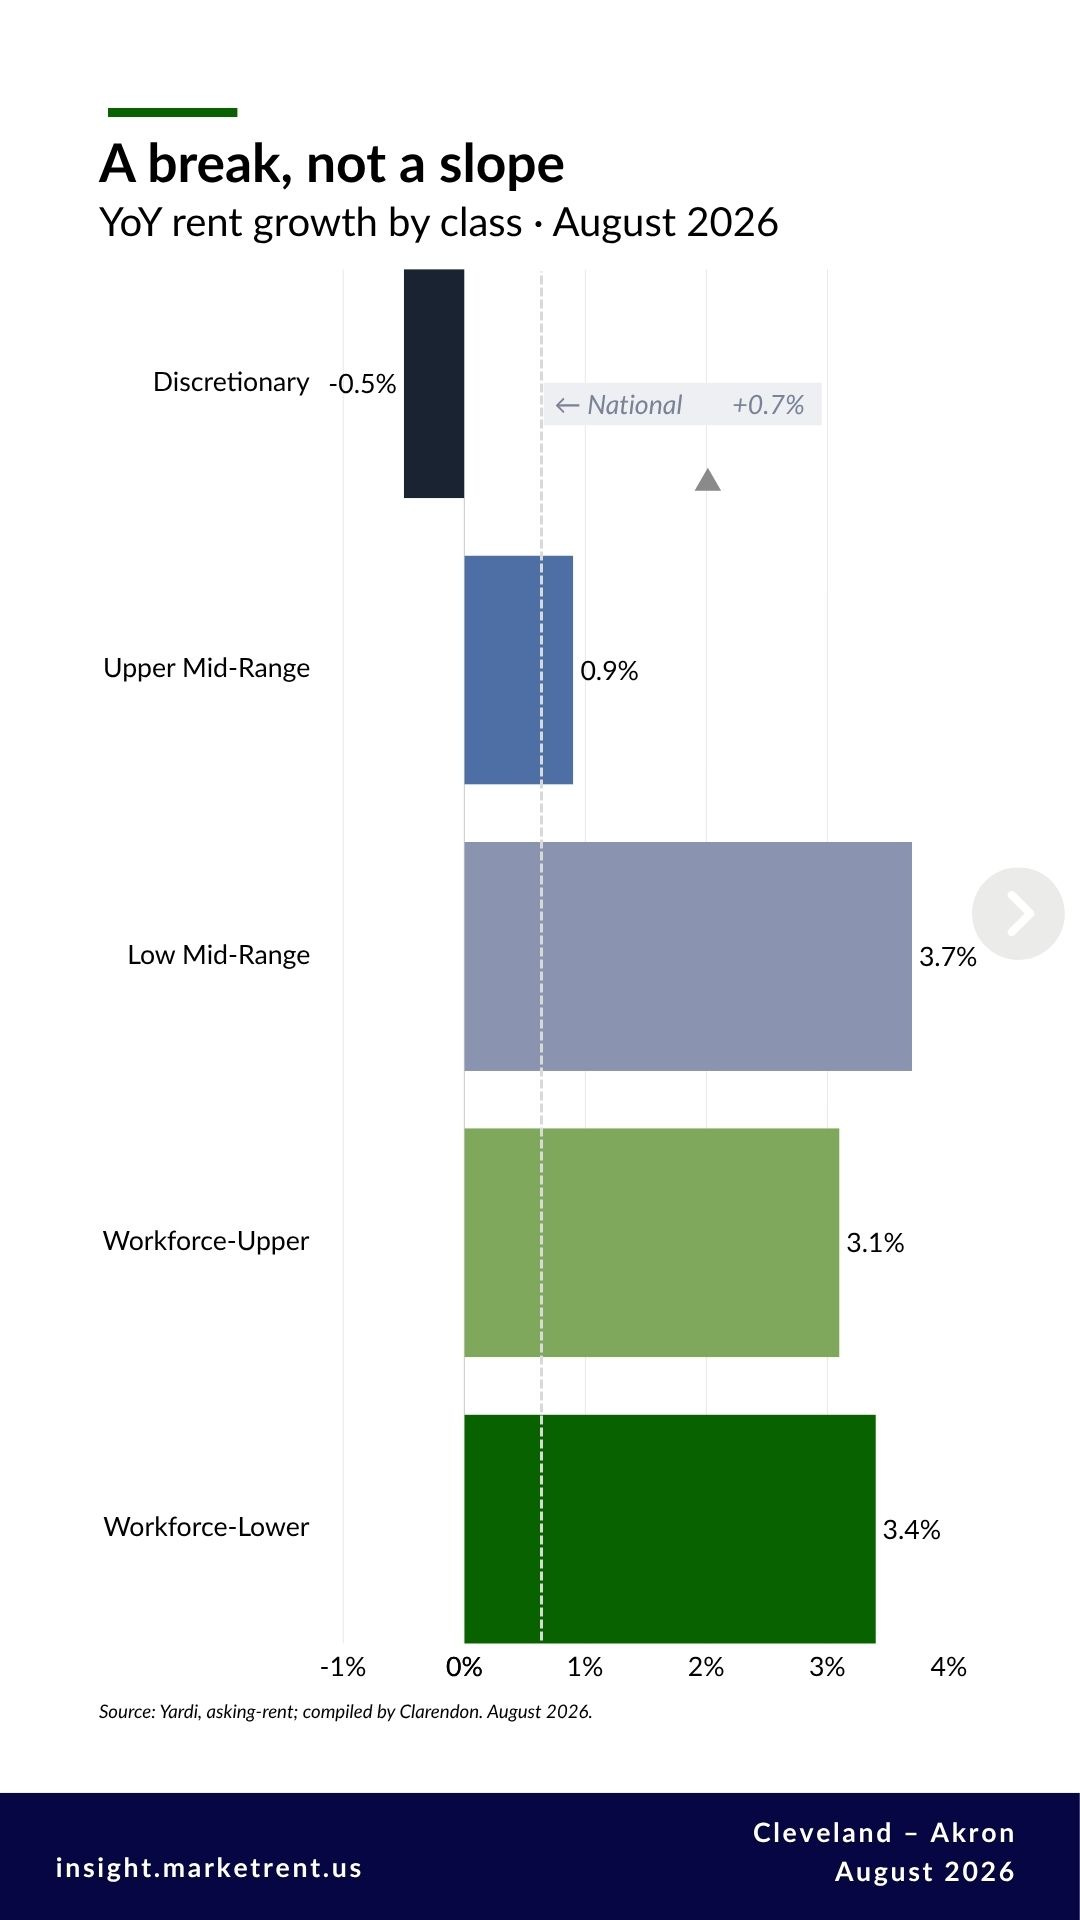
The top of the market is essentially flat. The three lower tiers are growing at roughly five times the national rate. Within a single year those three trade places. Over five years, they don’t.
Five years, same order
One year can be noise. Five years is a pattern.
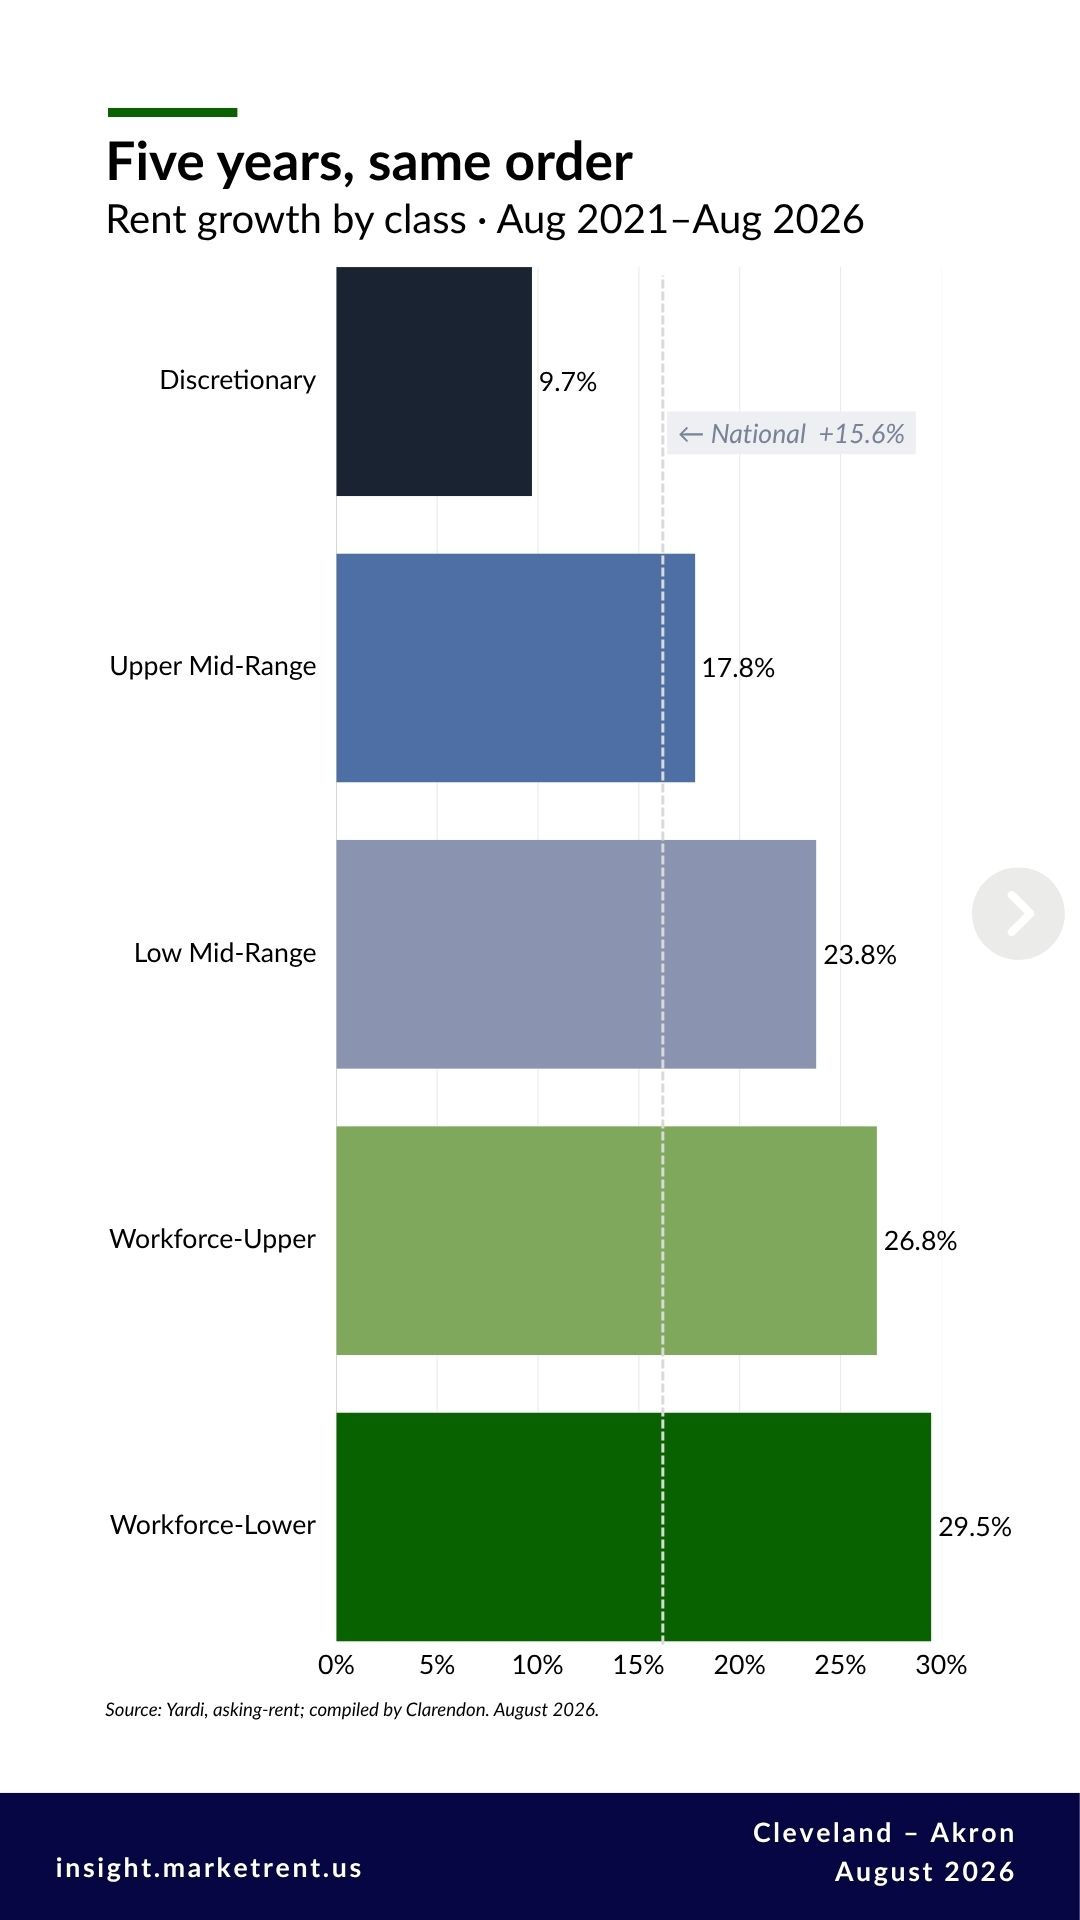
Measured from August 2021, before the surge peaked, Cleveland’s classes finish in exact order. Discretionary rents are up 9.7 percent over five years. Upper Mid-Range is up 17.8, Low Mid-Range 23.8, Workforce-Upper 26.8, and Workforce-Lower 29.5. The most affordable apartments in the metro have grown rents at three times the pace of the most expensive ones. That has held through the surge, through its correction, and into this year.
Occupancy tells the same story
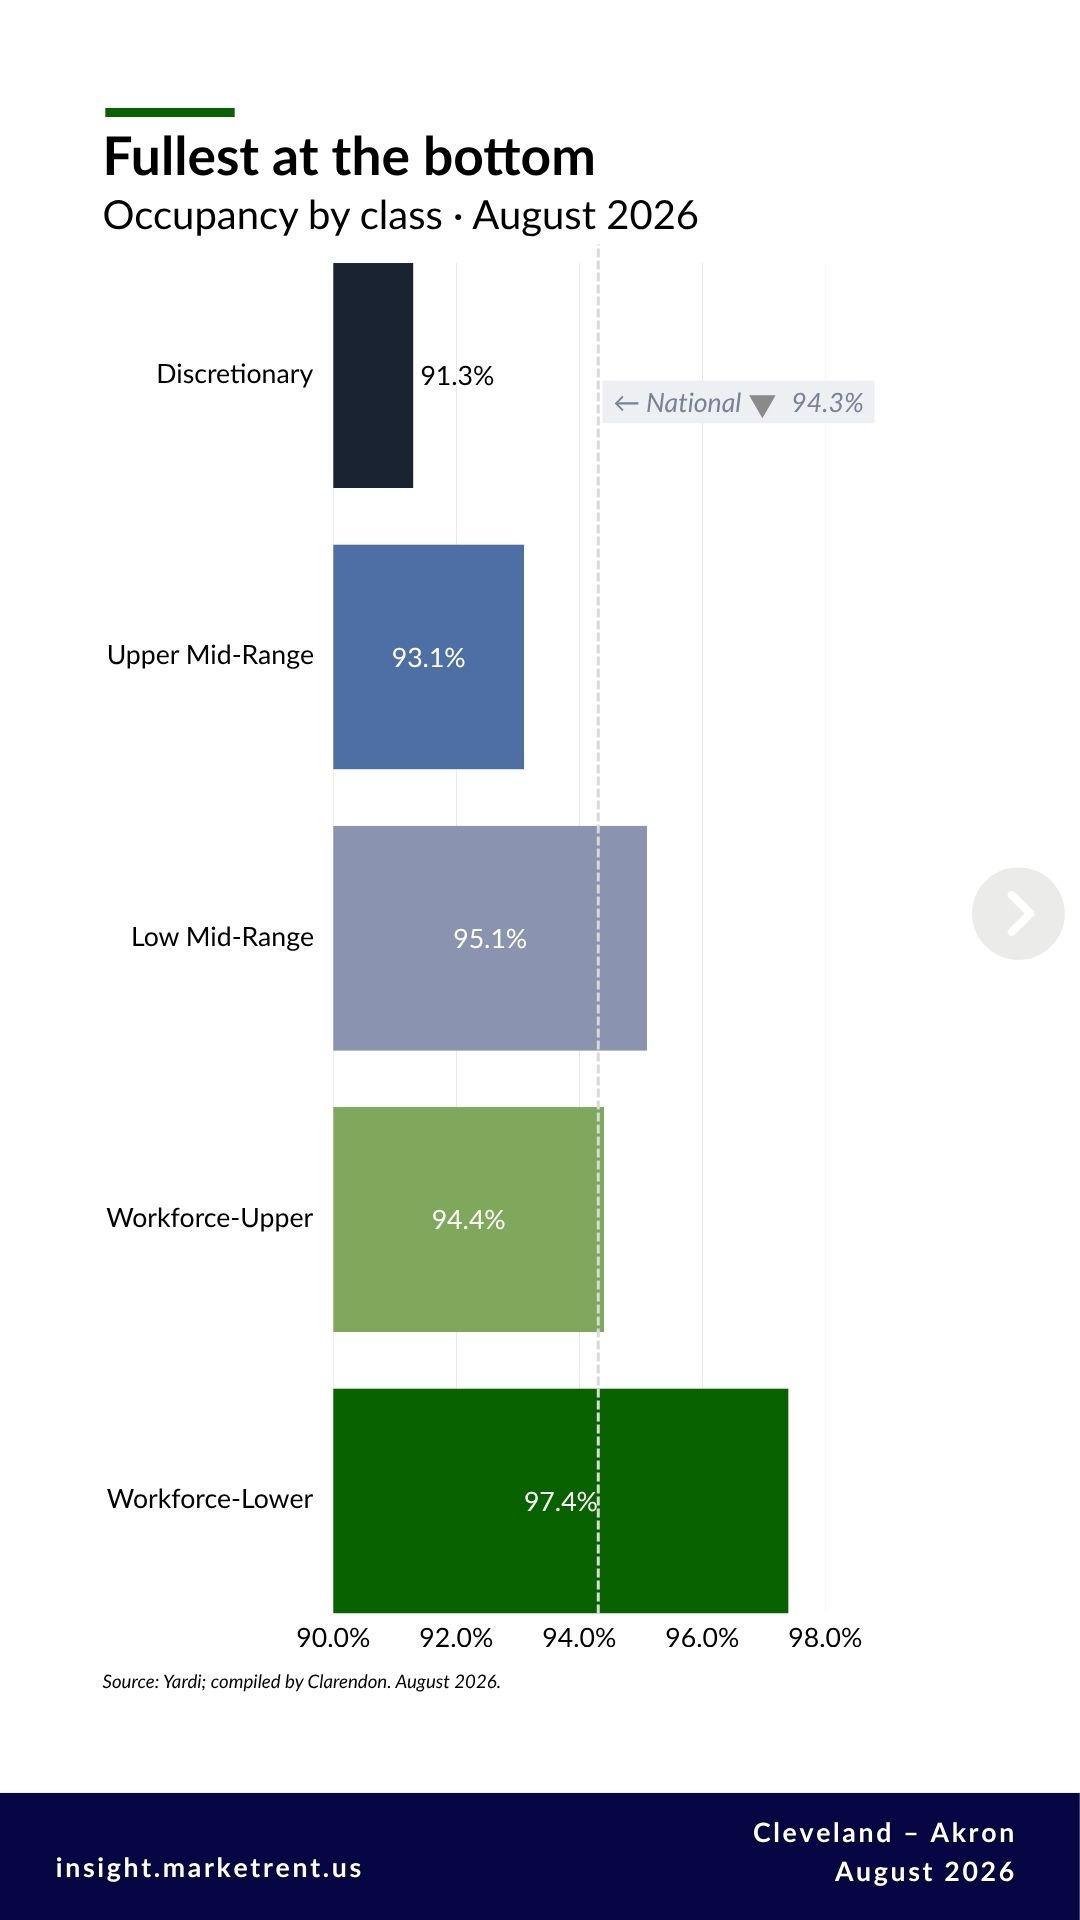
Occupancy usually moves before rent, and here it points the same way at both ends of the market. Workforce-Lower properties were 97.4 percent occupied in August, slightly higher than a year earlier. Discretionary properties were 91.3 percent occupied, down more than a full point over the same year. The segment with the strongest long-run rent growth is also the fullest. The segment with the flattest rents has the most room to fill.
Yardi’s pipeline data explains why. As of its June report, construction underway in Cleveland–Akron equals 6.8 percent of the existing Lifestyle inventory, the newer, higher-rent product, but only 0.6 percent of Renter-by-Necessity inventory. New supply is arriving almost entirely at the top of the market. The workforce segment is getting essentially none.
The map inside the metro
The same logic sorts the submarkets. Among submarkets with at least 1,000 surveyed units, the leaders over the past year were places with little new building: Lorain’s downtown up 9.5 percent, Brookpark 7.9, Eastlake 7.8. The softest were established suburbs, led by Westlake, down 2.7 percent, and Mayfield, down 1.4. Yardi’s June report tied Westlake’s softness to absorbing recent Lifestyle deliveries.
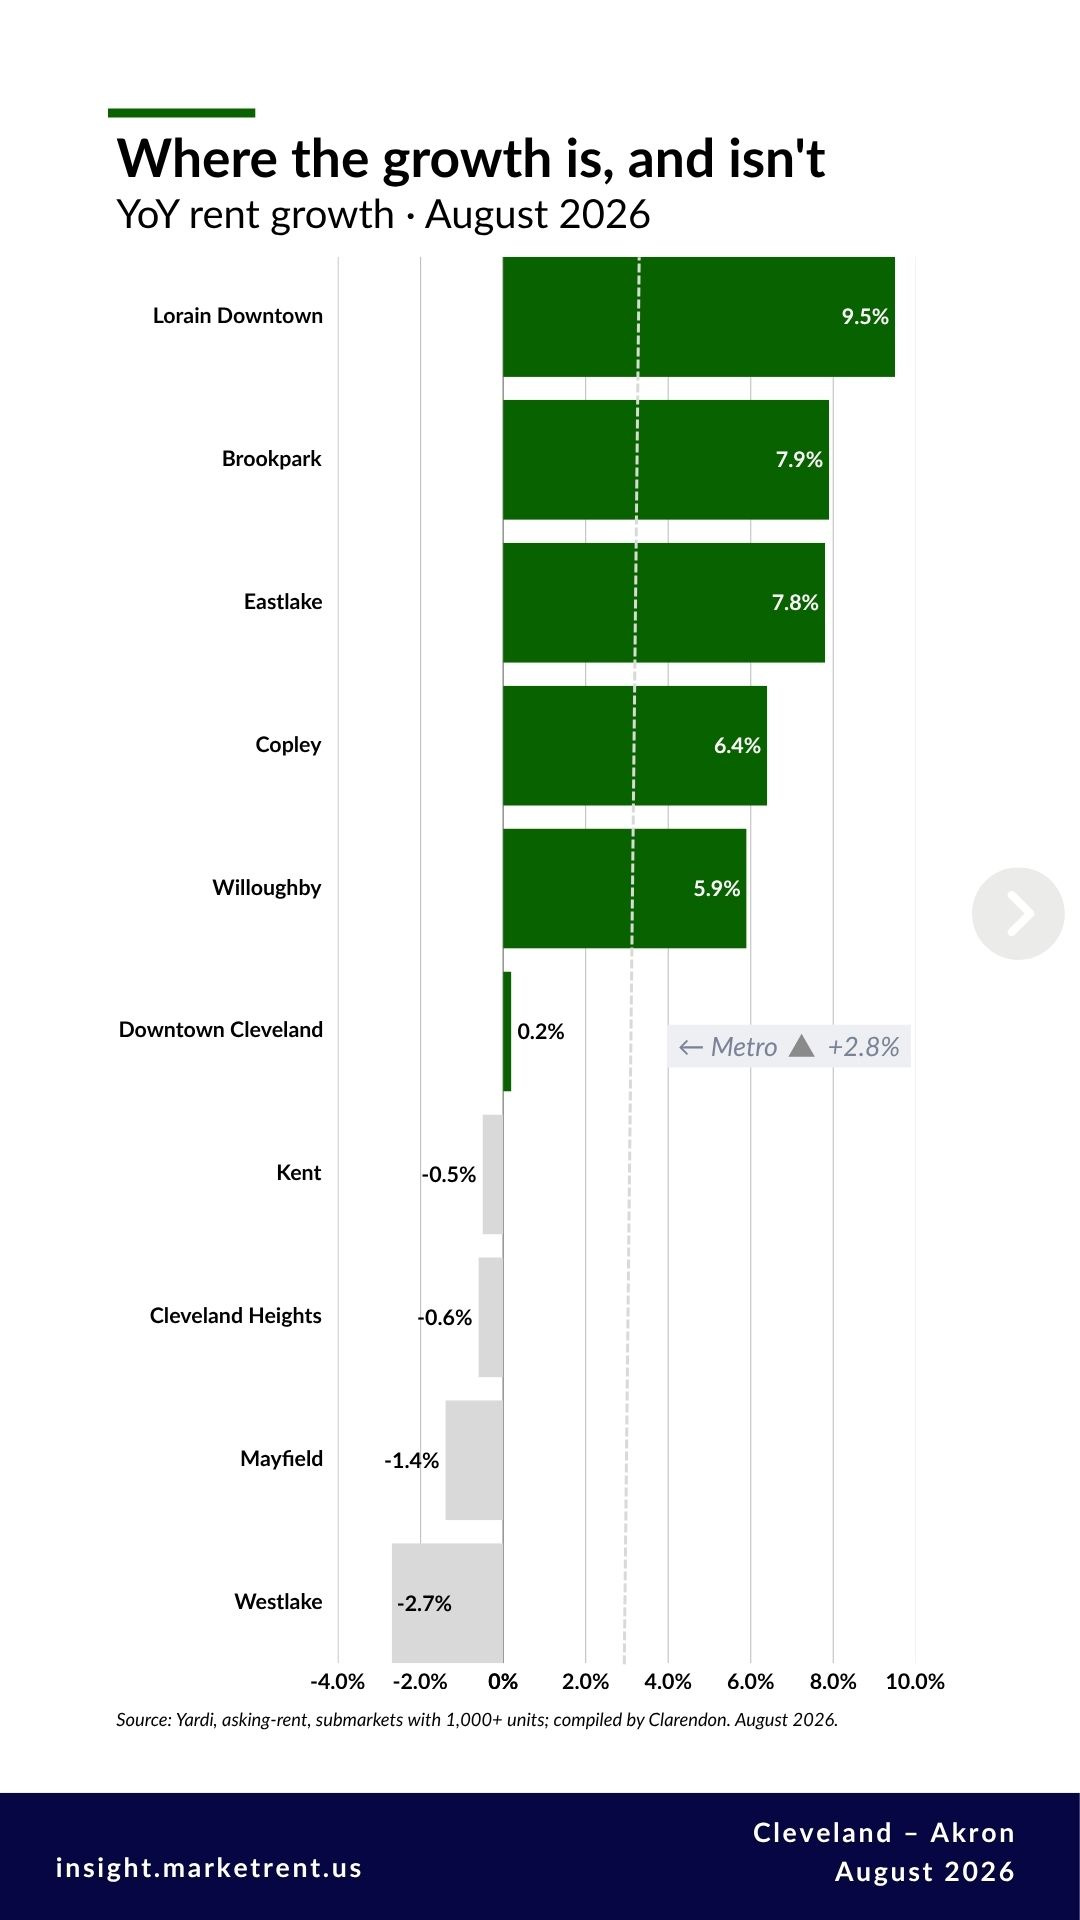
Downtown Cleveland is its own case. It grew 0.2 percent with occupancy at 87.9 percent, a market still leasing up the conversions that made it a national model for adaptive reuse. That is the price of being early, and the lease-up is the opportunity: downtown is absorbing supply the rest of the metro never built.
What it means
For owners of Section 8 properties, the finding is practical. Market alignment is a question about class, not about metro averages. A Section 8 contract renewal benchmarked against a metro-wide number, or against newly delivered Lifestyle product, reads the wrong market. Most assisted properties compete in the workforce tiers, and in Cleveland those tiers have outgrown the metro for five straight years. The comparables that matter in a HUD Rent Comparability Study are the ones that compete for the same renter.
For investors, the same data describes the segment with the strongest five-year rent growth, the highest occupancy, and the thinnest pipeline in the metro, all at once. That combination is rare, and it tends not to last once it is widely noticed.
Nationally, the story took five regions to tell. In Cleveland it takes five classes, and they read the same way. The rent growth is where the supply isn’t, at every scale we’ve measured so far. The difference at the local scale is that it points to specific buildings.
More on Cleveland–Akron


Pulse — What We’re Tracking
FY2027 Fair Market Rents take effect today. HUD’s new FMRs and Small Area FMRs now govern voucher payment standards. Nationally the Small Area benchmark rose 1.7 percent, the smallest increase in five years. Our SAFMR analysis covers why the benchmark trails the market by roughly two years. Cleveland and Akron are mandatory Small Area FMR areas, so payment standards vary by ZIP code. The SAFMR heat map shows how each one moved. HUD User, FY2027 Fair Market Rents
The refinancing wall arrives, and it isn’t evenly distributed. Apartment owners face roughly $757 billion in maturities from 2026 through 2028, nearly $300 billion of it this year, and loans written near 3 percent are refinancing near 6. The pressure sits in interest-only bank, bridge and CMBS debt from 2021–22. Fully amortizing loans, including the FHA-insured debt behind much of the Section 8 stock, face far smaller gaps. Whether a loan refinances depends on how much rent has grown since it was written, and that varies sharply by region and class. The Wall Street Journal

The FY2027 data is live on marketrent.us The SAFMR heat map covers every ZIP code by bedroom count, with the change from last year. The calculator does the same for a single ZIP and marks the 150 percent threshold: FY2027 for anything renewing on or after October 1. Both are free with a MarketRent™ account, along with the market briefs and Ask MarketRent, which answers questions against everything published here.

For questions on this report, contact Eve Moss, founder of Clarendon and editor of MarketRent™. The Cleveland–Akron Q3 Market Brief publishes in November.
Data: Yardi Matrix, asking-rent basis. Cleveland–Akron figures from Yardi Matrix market data exports by submarket and asset class, data through August 2026, compiled by Clarendon; year-over-year metro changes are unit-weighted on a same-submarket basis. Pipeline shares from Yardi Matrix MarketPoint, Cleveland–Akron, June 2026. National figures from the MarketRent™ Monthly, August 2026. Figures may revise as additional properties report.

Archive • About • Tools • Services •Contact
About Clarendon: Clarendon is a commercial real estate advisory firm specializing in affordable and multifamily housing — providing brokerage, valuation, HUD Rent Comparability Studies, market studies, and appraisals for owners, investors, housing authorities and agencies nationwide.
© 2026 The Clarendon Group, Inc. All Rights Reserved. Disclosure